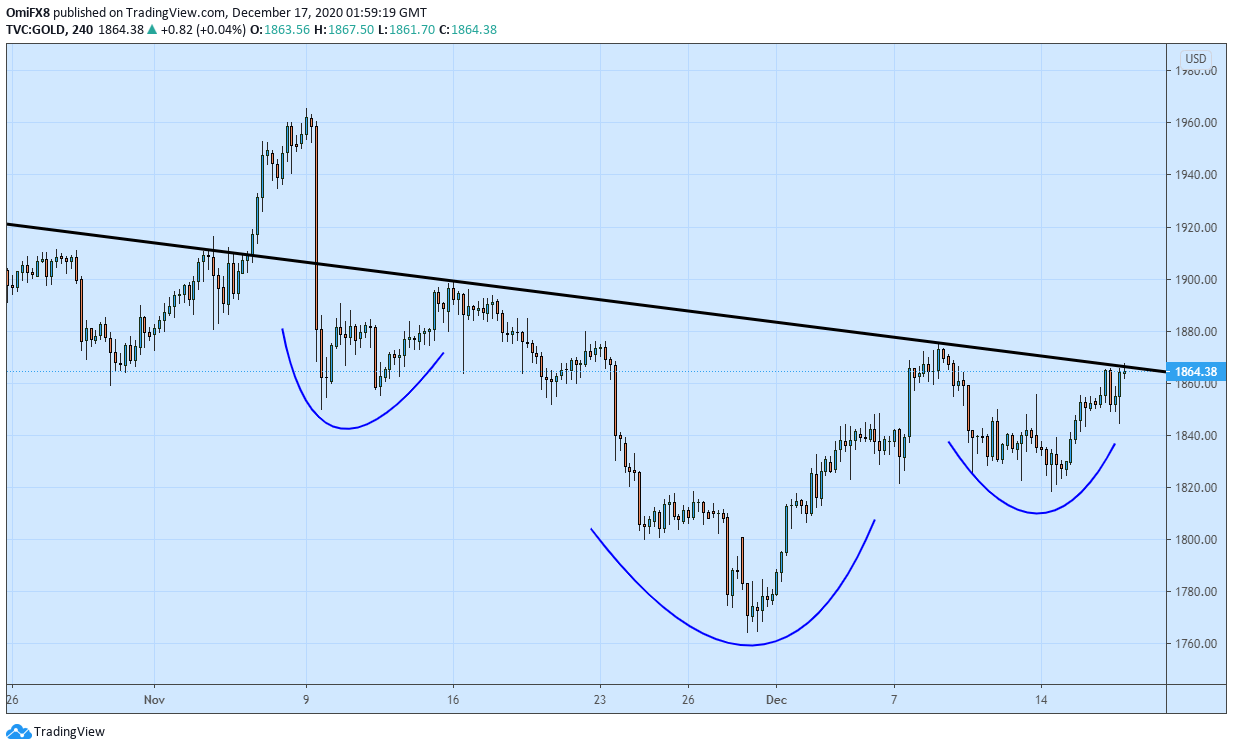
- Gold’s 4-hour chart shows an inverse head-and-shoulders pattern.
- A breakout would open the doors to a re-test of Nov. 9 highs.
Gold is currently trading near a key hurdle, which, if breached, could bring a stronger rally.
The yellow metal is flirting with resistance at $1,866 – the neckline of the inverse head-and-shoulders pattern. Acceptance above would confirm a breakout or bearish-to-bullish trend change and create room for a rally to $1,966 (target as per the measured move method). On the way higher, the metal may face resistance at $1,900.
A strong rejection at the neckline hurdle would shift risk in favor of a drop to $1,820 (4-hour chart support).
Fundamental factors such as the Federal Reserve’s bond purchases, the record global stockpile of negative-yielding bonds, and weak dollar support the bullish case.
4-hour chart
Trend: Bullish
Technical levels
