- Gold has pulled back of the last few sessions after Central Bankers pledge support.
- XAU/USD has consolidated under $1600 and continues to look bearish.
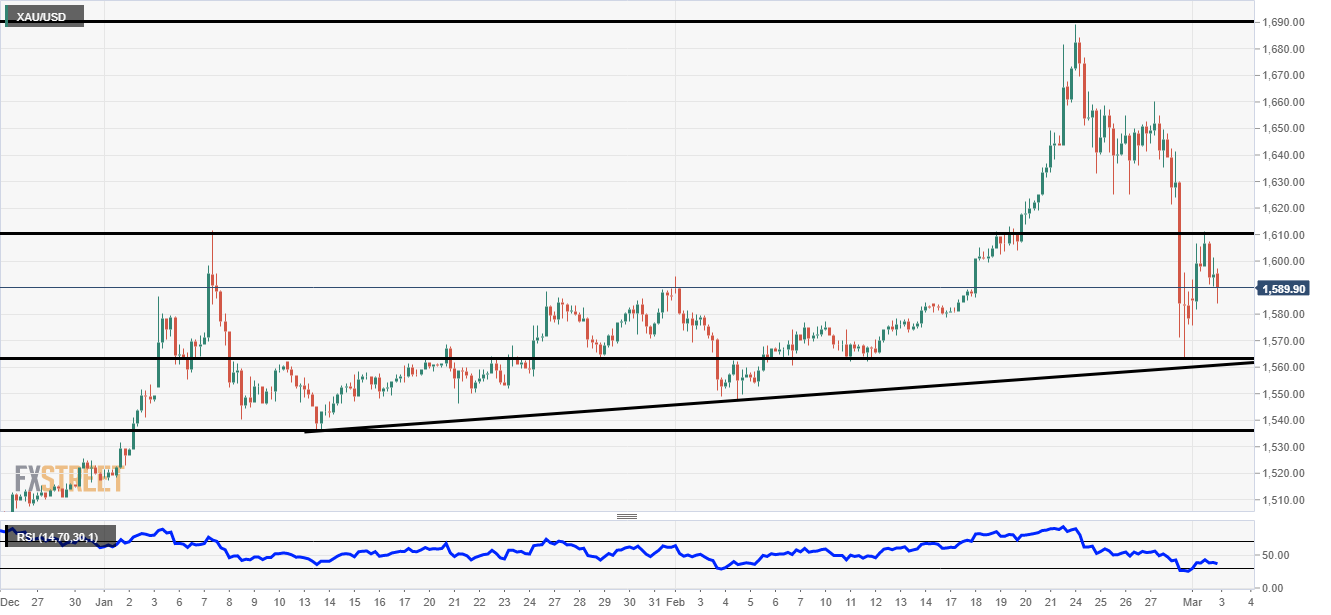
Gold 4-Hour Chart
Gold has capitulated in recent sessions as the Federal Reserve and other central banks pledge their support to the financial markets.
Last week stocks rebounded of lows and gold pulled back from its highs after Fed Chair Powell said the Fed could cut rates.
Subsequently, the markets have been pricing potential Fed rate cuts throughout the year.
Gold hit $1,689.40 per ounce at its recent peak. Just 6 days later the price is at $1589.35 per ounce.
On the chart there are a few support zones to keep an eye on $1562.94 is the previous wave low and just beyond that, there is a trendline which could also provide support.
Just this weekend the US administration announced further tests would be rolled out so watch out for further news.
Additional Levels
