Gold has been trying to lick its wounds after falling from the recent all-time high of $2,075 after US Non-Farm Payrolls beat expectations with 1.763 million jobs gained. The US dollar strengthened and the pendulum went against the precious metal.
Markets are worried about escalating Sino-American tensions. China is moving toward sanctioning Senators Marco Rubio and Ted Cruz in response to US action against Hong Kong leader Carrie Lam. Clashes around Taiwan, TikTok, and other topics are causing concerns for markets.
XUA/USD has also struggled with the ongoing fiscal impasse on Capitol Hill. How is gold positioned on the charts? There is less-worrying news for bulls on this front.
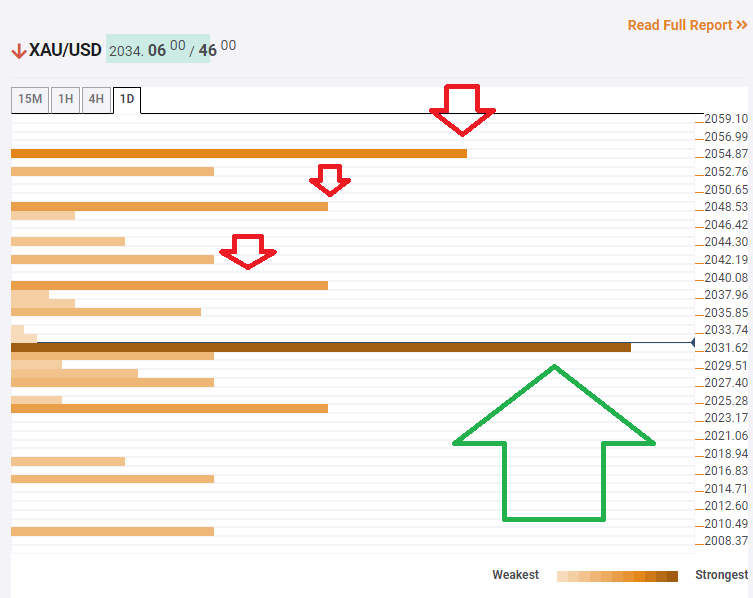
The Technical Confluences Indicator is showing that XAU/USD surpassed the strong $2,031 line, which is the convergence of the Bollinger Band 1h-Middle, the Simple Moving Average 10-15m, the SMA 5-4h, the Fibonacci 38.2% one-week, and more.
Looking up, gold faces weaker resistance. The first line to watch is $2,038, which is the meeting point of the Fibonacci 38.2% one-day and the SMA 10-4h.
The next cap is at $2,048, which is where the Fibonacci 23.6% one-week and the SMA 200-15m meet.
The upside target is $2,054, which is the confluence of the Fibonacci 61.8% one-day and the Pivot Point Resistance 1.
Overall, the upside seems more appealing.
Key XAU/USD resistances and supports
Confluence Detector
The Confluence Detector finds exciting opportunities using Technical Confluences. The TC is a tool to locate and point out those price levels where there is a congestion of indicators, moving averages, Fibonacci levels, Pivot Points, etc. Knowing where these congestion points are located is very useful for the trader, and can be used as a basis for different strategies.
Learn more about Technical Confluence
