- Gold lacks clear directional bias for the second day.
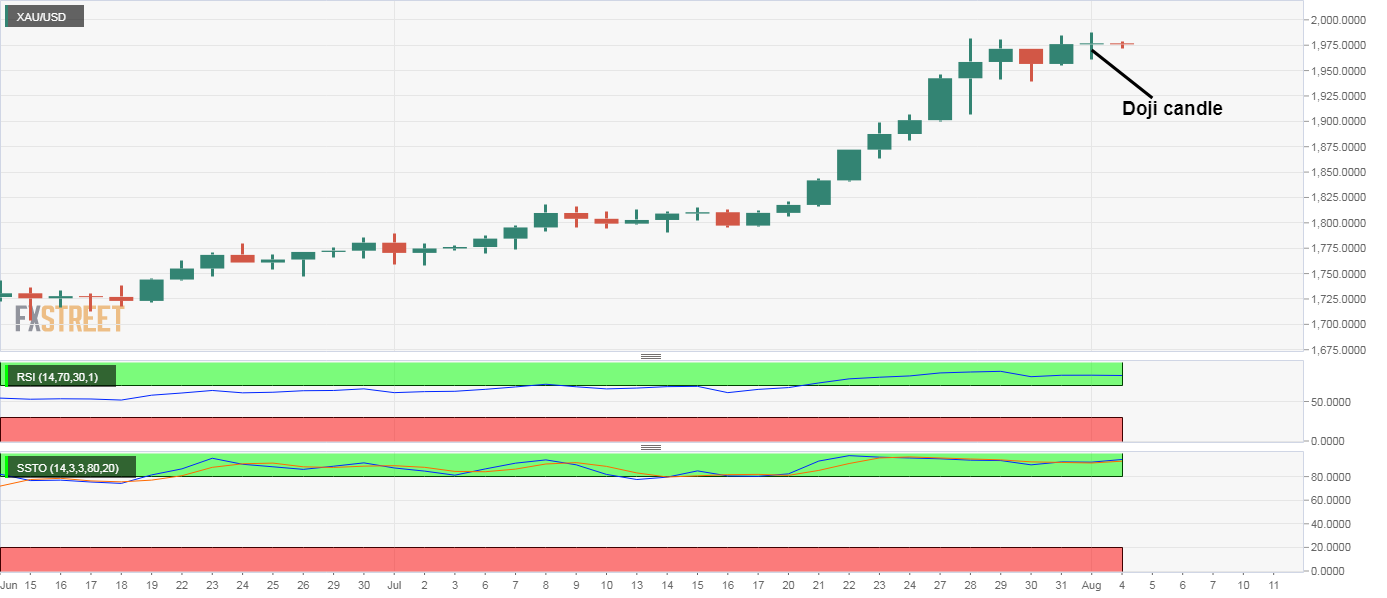
- Monday’s Doji candle is indicative of buyer exhaustion.
- Daily chart indicators continue to report overbought conditions.
Gold is currently trading sidelined near $1,975, having witnessed a two-way business and a flat close on Monday.
Essentially, the yellow metal created a Doji candle on Monday, which comprises long wicks and a small or negligible body. The Doji candle is widely considered to be a sign of indecision in the market place.
In this case, however, the candle has appeared at record highs and following a meteoric rise from $1,450 to $1,988 and indicates buyer exhaustion.
That, alongside overbought readings on key indicators like the 14-day relative strength index (RSI) and slow stochastic, suggests scope for price pullback.
Moreover, the short-term trend would turn bearish if prices end Tuesday below $1,960 – the low of Monday’s Doji candle. That would expose the support of the 200-hour simple moving average, currently at $1,938.
On the higher side, $2,000 is a key hurdle. The bulls may have a tough time establishing a strong foothold above the psychological resistance amid overbought conditions.
Daily chart
Trend: Bull exhaustion
Technical levels
