- Gold has confirmed a bull pennant breakout on the hourly chart.
- A bull cross is also spotted with RSI in the overbought territory.
- Attention shifts towards the NFP data and next week’s FOMC minutes.
Gold (XAU/USD) staged a solid comeback from multi-month troughs and rallied over 1% on Friday, courtesy of the sell-off in the US dollar across the board.
The greenback tumbled in sync with the Treasury yields amid risk-on market mood. Gold’s fate now hinges on the all-important US NFP report, with the US economy expected to add 647K jobs in March.
Looking at gold’s hourly chart, the odds are in favor of further upside after a bull flag formation got validated into the weekly closing on Thursday.
Adding credence to a potential move higher, the said time frame also displays a bull crossover, with the 21-hourly moving average (HMA) having peeped above the 200-HMA.
Gold Price Chart: One-hour
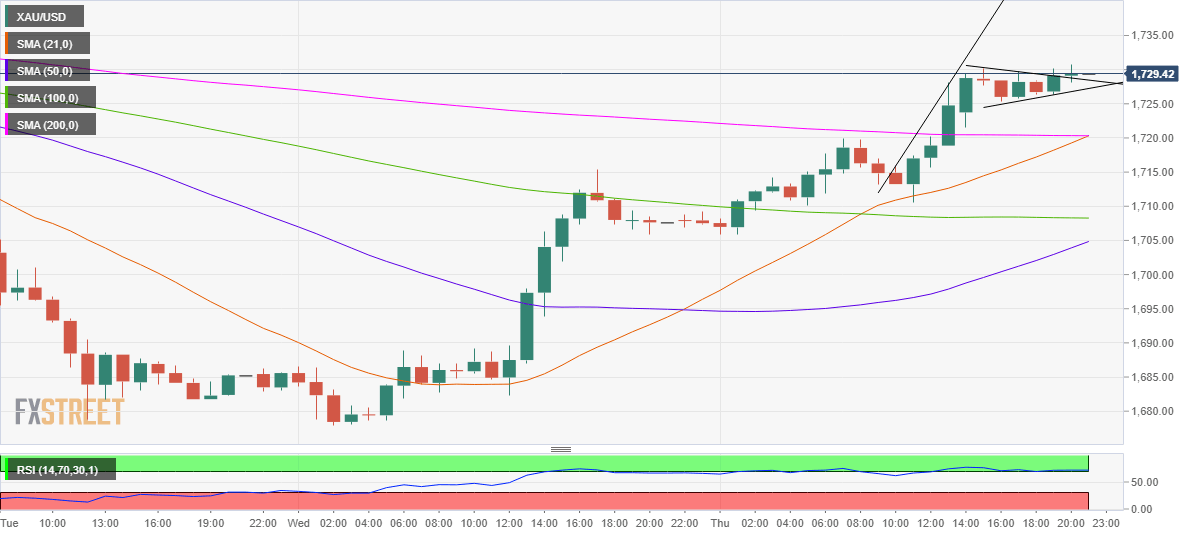
With the bull flag now in play, gold remains poised to test the pattern target at $1747.
The Relative Strength Index (RSI) reflects overbought conditions. Therefore, the buyers could see a temporary pullback in prices before the corrective upside resumes.
To the downside, the confluence of the 21 and 200-HMAs at $1720 could offer immediate comfort to the XAU bulls.
If the bearish pressure intensifies, a test of the 100-HMA at $1708 could be inevitable.
Gold: Additional levels
