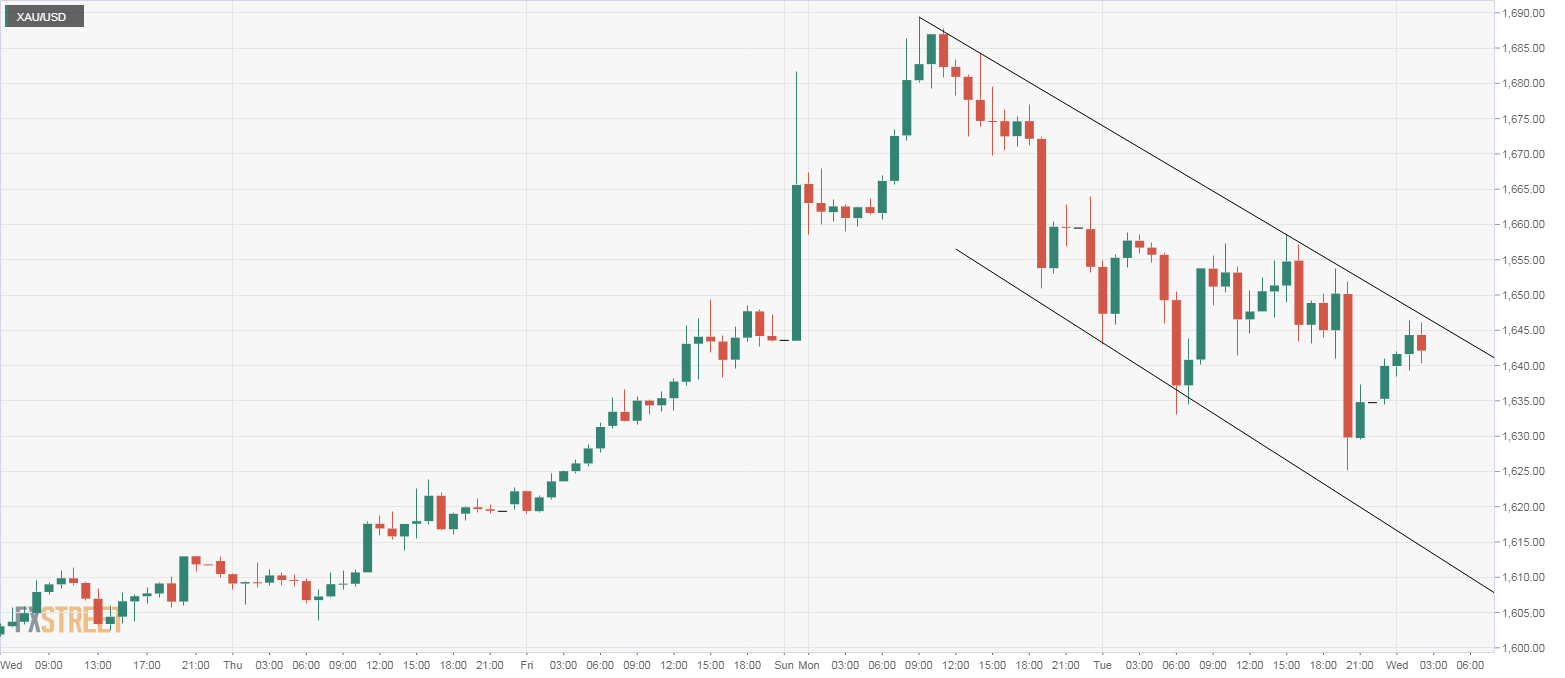
- Gold’s hourly chart shows the metal is stuck in a bearish channel.
- A break above $1,647 is needed to confirm a bullish breakout.
Gold is flashing green in Asia, but the bias remains bearish with prices still trapped in a falling channel on the hourly chart.
At press time, the yellow metal is trading at $1,642 per Oz, representing 0.45% gains on the day.
While the recovery from the overnight low of $1,625 is encouraging, the metal is yet to challenge the falling channel resistance at $1,647. An hourly close above that level would imply an end of the pullback from recent highs near $1,690 and would shift risk in favor of a rise to $1,660 (a lower high on the hourly chart).
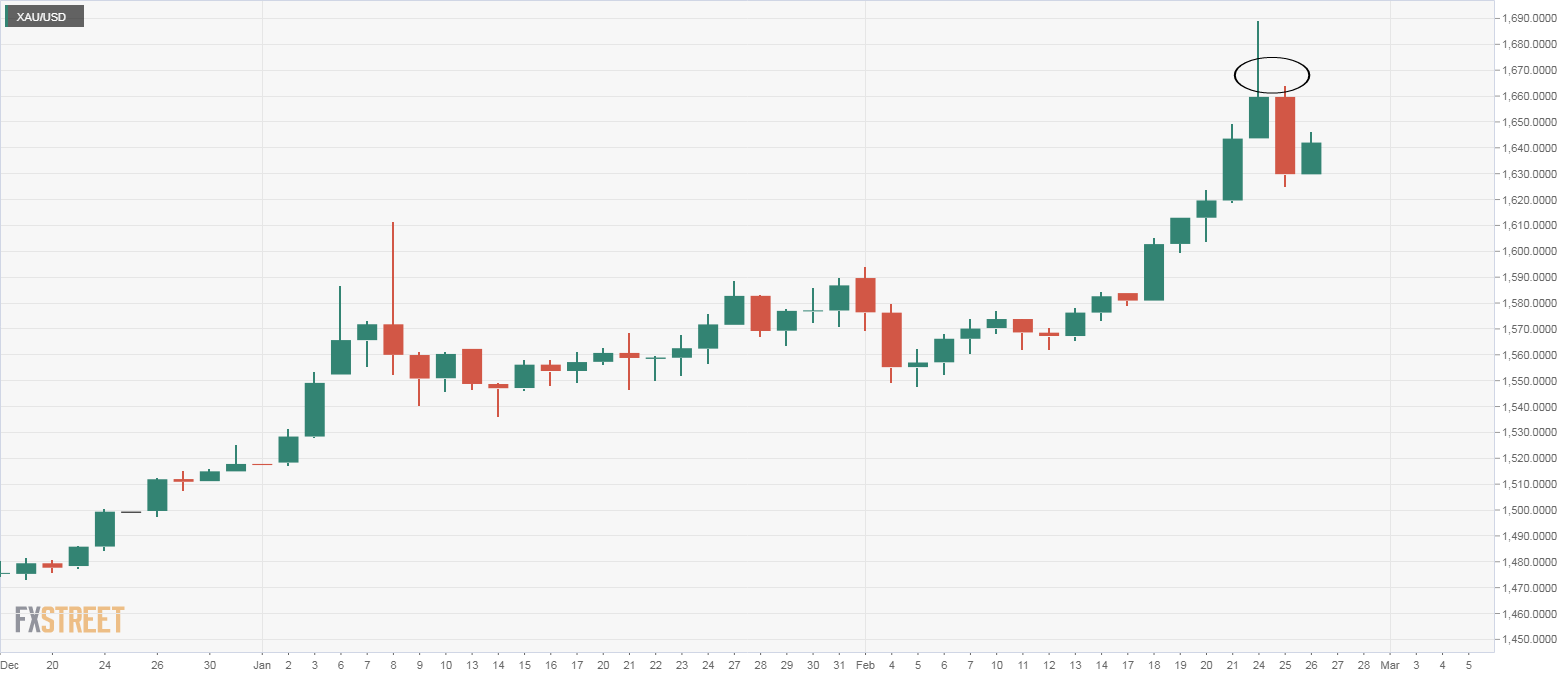
A breakout will likely remain elusive if prices find acceptance under the session low of $1,634. That would validate the bearish reversal pattern seen on the daily chart and could yield deeper declines toward $1,611 (Jan. 8 high).
Hourly chart
Daily chart
Trend: Bearish
Technical levels
