- Gold has been clawing its way back above the round $1,900 level.
- The Confluence Detector shows that the precious metal is trading in
- Gold prices pull back as traders book profits – What’s next? [Video]
It seems impossible to keep XAU/USD down for too long – the precious metal has staged a comeback and trades above the $1,900 at the time of writing. The dip below that level was triggered by robust US data, especially signs of rising inflation. While the precious metal is often seen as a hedge against rising prices, the specter of rate hikes from the Federal Reserve makes the yieldless gold less attractive.
As the debate continues, the charts are pointing to a clear range.
Where next for gold from here?
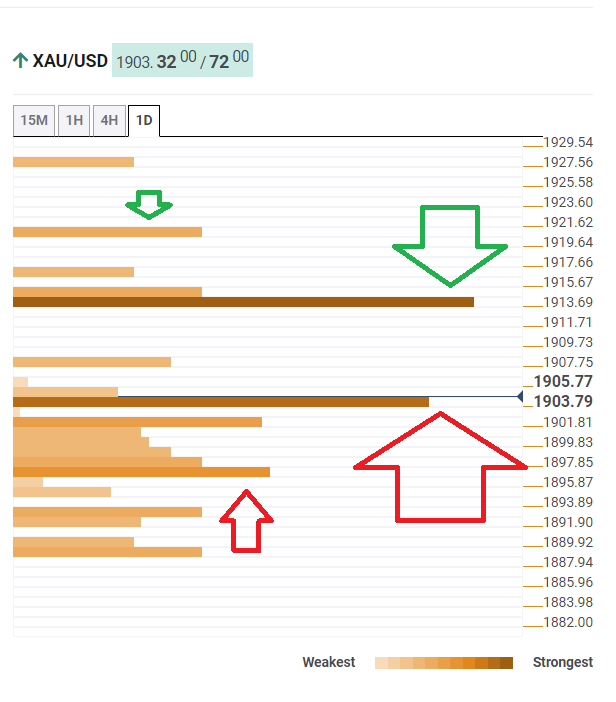
The Technical Confluences Detector is showing that XAU/USD has strong support at $1,903, which is the convergence of the Bollinger Band 4h-Middle, the Fibonacci 23.6% one-week, the BB 1h-Upper and more.
The upper side of that range is $1,913, which is a juncture including the previous month’s high, the BB 4h-Upper, and the Pivot Point one-day Resistance 1.
Further above, the upside target is $1,920, which is where the Pivot Point one-week R2 hits the price.
Support awaits at $1,896, which is the confluence of the Fibonaccis 38.2% one week and the Simple Moving Average 50-4h.
All in all, the path of least resistance is up – support lines are stronger than resistance ones.
XAU/USD resistance and support levels
Confluence Detector
The Confluence Detector finds exciting opportunities using Technical Confluences. The TC is a tool to locate and point out those price levels where there is a congestion of indicators, moving averages, Fibonacci levels, Pivot Points, etc. Knowing where these congestion points are located is very useful for the trader, and can be used as a basis for different strategies.
Learn more about Technical Confluence
