Gold has made its way back above the $1,900 level, attempting to recover. Earlier, it dropped as Democrats and Republicans blamed each other for “moving the goal posts” on fiscal stimulus talks. The precious metal continues having a robust correlation with speculation about a multi-trillion relief package from Washington.
Election uncertainty is also weighing on markets, but having a more muted impact on XAU/USD.
How is gold positioned on the charts?
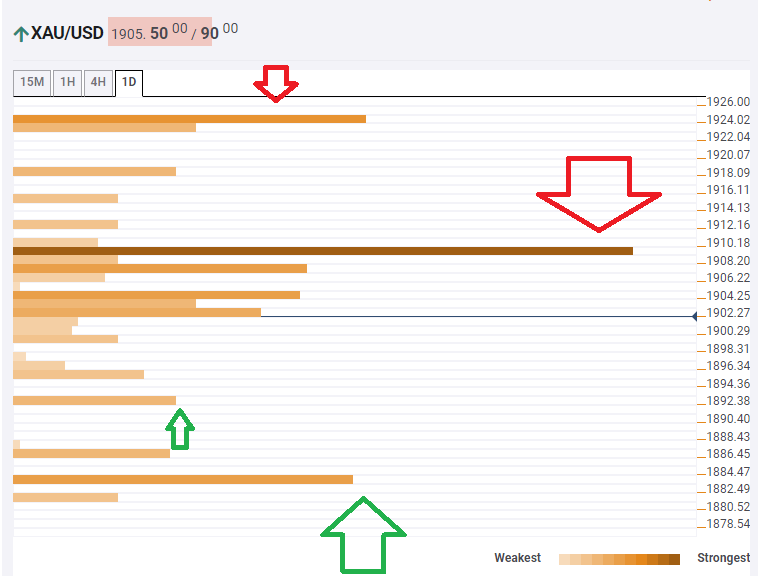
The Technical Confluences Indicator is showing that XAU/USD is capped under $1.909, which is the convergence of the Fibonacci 61.8% one-week and the Bollinger Band 4h-Middle. As the graphic below shows, it is the most robust level.
Looking up, the next target is $1,923, which is a juncture of lines including the Pivot Point one-day Resistance 2, the 50-day Simple Moving Average, and the PP one-week R1.
Some support awaits at $1,891, which is the confluence of the BB 4h-Lower and the PP one-day S1.
Further down, gold has further support at $1,883, which is the meeting point of the Fibonacci 23.6 and the one-month, the PP one-day S2.
All in all, the path of least resistance is down.
Key XAU/USD resistances and supports
Confluence Detector
The Confluence Detector finds exciting opportunities using Technical Confluences. The TC is a tool to locate and point out those price levels where there is a congestion of indicators, moving averages, Fibonacci levels, Pivot Points, etc. Knowing where these congestion points are located is very useful for the trader, and can be used as a basis for different strategies.
Learn more about Technical Confluence
