- Gold reached its highest level since early January on Tuesday.
- 10-year US Treasury bond yield is up more than 2%.
- Additional losses are likely if XAU/USD closes below $1,900.
- Gold Weekly Forecast: XAU/USD bulls not yet ready to give up on additional gains
Update: As per the Chart of the Week forecasted, the Gold (XAU/USD) price rallied to score a fresh daily high following a restest of the support structure. However, it failed to extend with momentum and has started to carve out a bearish closing candle for the day. There are also prospects for a bearish continuation according to the hourly time frame.
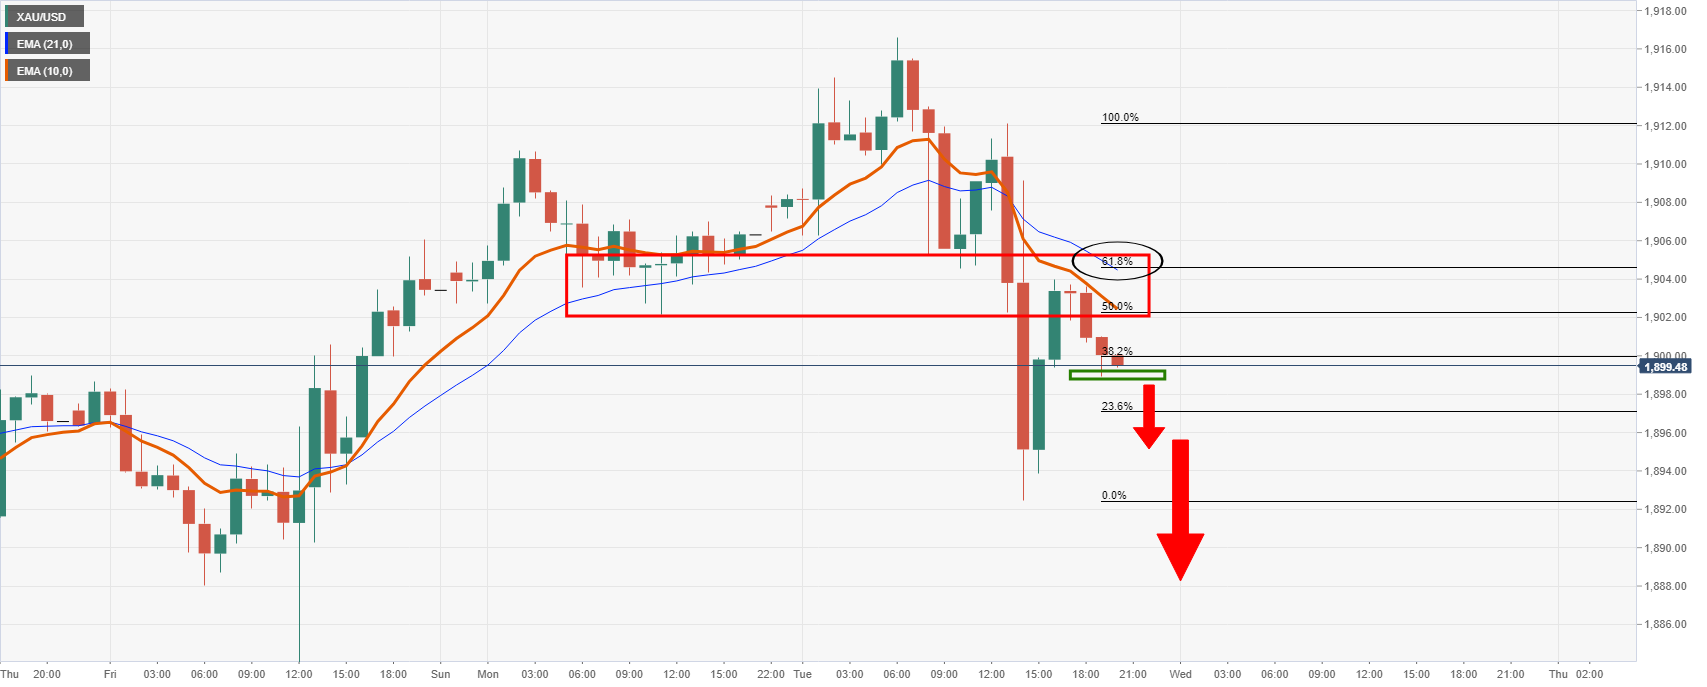
The hourly resistance structure and the confluence of the bearish 10 and 20 EMAs have pressured bulls into retreat just ahead of a 61.8% Fibonacci retracement level at $1,904.
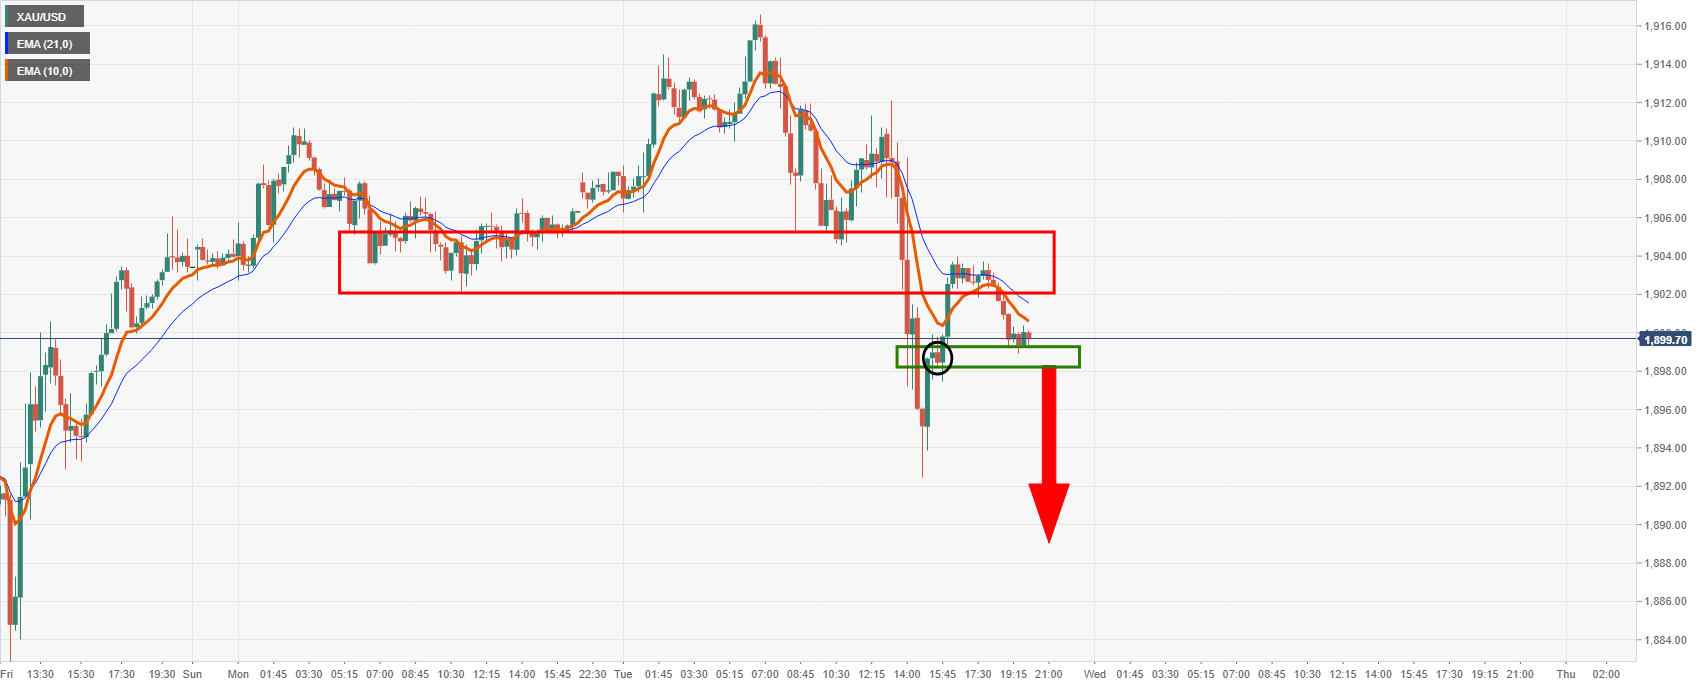
From a 15-min perspective, however, bears will want to see the support structure give way for additional bearish conviction:
End of the update…
Following Monday’s choppy session, the XAU/USD pair gained traction during the Asian trading hours on Tuesday and reached its highest level since early January at $1,916. However, gold struggled to preserve its bullish momentum and dropped all the way to $1,892 before going into a consolidation phase. As of writing, XAU/USD was down 0.2% on the day at $1,903.
US T-bond yields push higher after latest US data
Earlier in the day, the greenback struggled to find demand as a safe haven amid the risk-positive market environment. Nevertheless, the sharp upsurge witnessed in the US Treasury bond yields weighed on gold in the second half of the day. Currently, the 10-year US Treasury bond yield is rising more than 2% on a daily basis at 1.611%.
The data from the US revealed on Tuesday that the business activity in the manufacturing sector continued to expand at an impressive pace in May. The Markit Manufacturing PMI improved to 62.1 from 60.5 in April and the ISM Manufacturing PMI rose to 61.2 from 60.7. The underlying details of these reports revived concerns over inflation and provided a boost to T-bond yields.
Chris Williamson, Chief Business Economist at IHS Markit, noted prices charged by manufacturers increased at an “unprecedented rate” due to soaring input costs and unparalleled capacity constraints. Moreover, the Prices Paid Index component of the ISM Manufacturing PMI report arrived at 88, surpassing the market expectation of 86.8.
There won’t be any high-tier data releases featured in the US economic docket on Wednesday and gold continue to react to fluctuations in US T-bond yields.
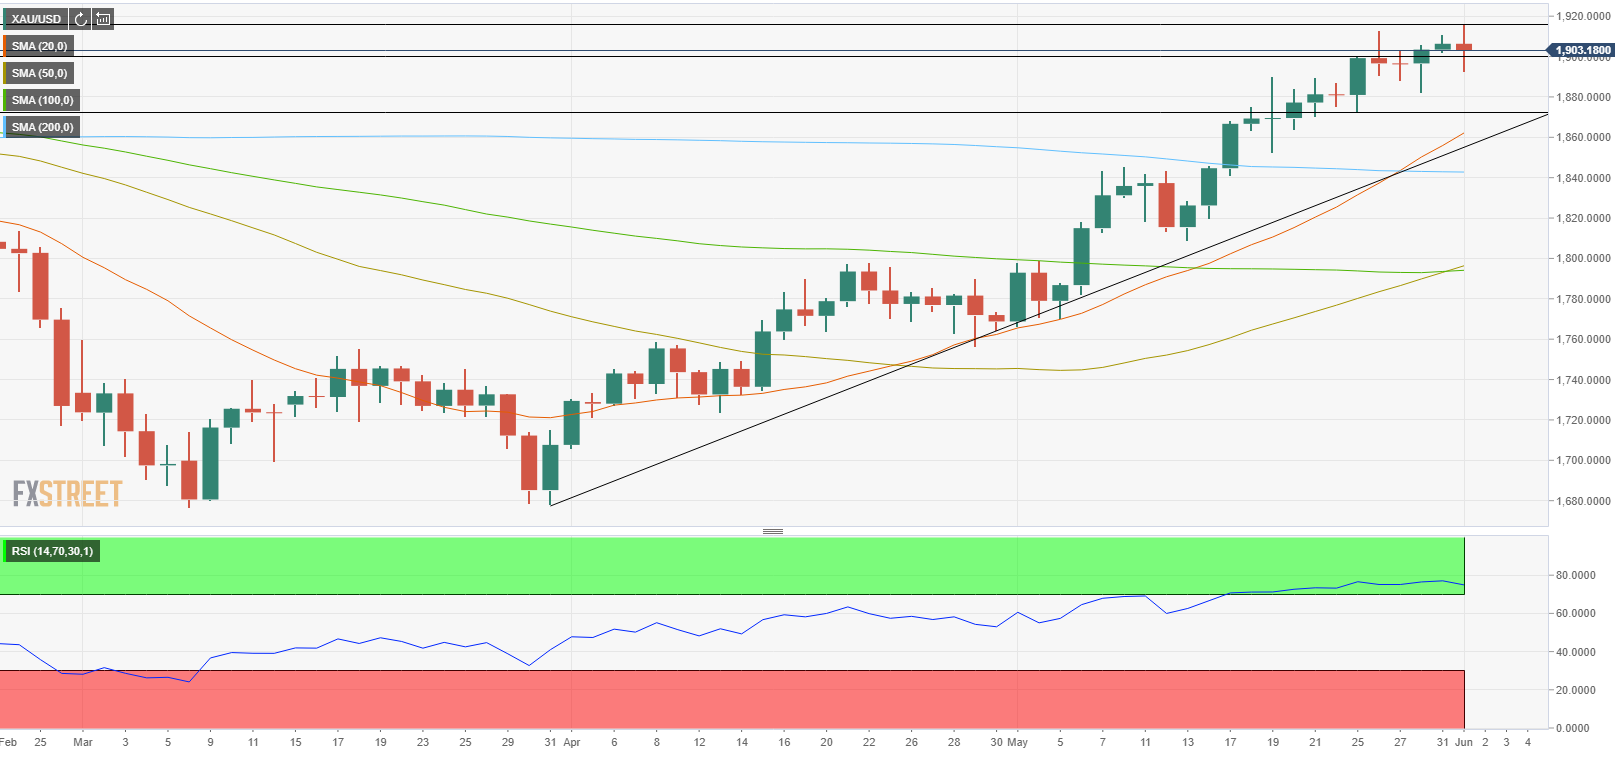
Gold technical outlook
Despite Tuesday’s modest decline, the Relative Strength Index (RSI) indicator on the daily chart continues to float above 70, suggesting that gold needs to continue to edge lower in order to correct its overbought reading. However, buyers continue to defend $1,900 (psychological level) and additional losses could be seen if gold manages to make a daily close below that level. The next target on the downside could be seen at $1,870 (static level, ascending line coming from late March).
On the other hand, a resistance area seems to have formed in the $1,912/15 area (May 26 high, June 1 high) ahead of $1,930 (static level).