- Gold prices could be due for a bullish retest of resistance.
- XAU/USD has met a significant Fibonacci retracement level on the daily chart that is expected to hold.
The monthly chart shows that the correction of the bullish trend met a 50% mean reversion before recovering into what would be expected to to be the start of a fresh bullish impulse that should exceed the record highs at some stage later this year.
Monthly chart
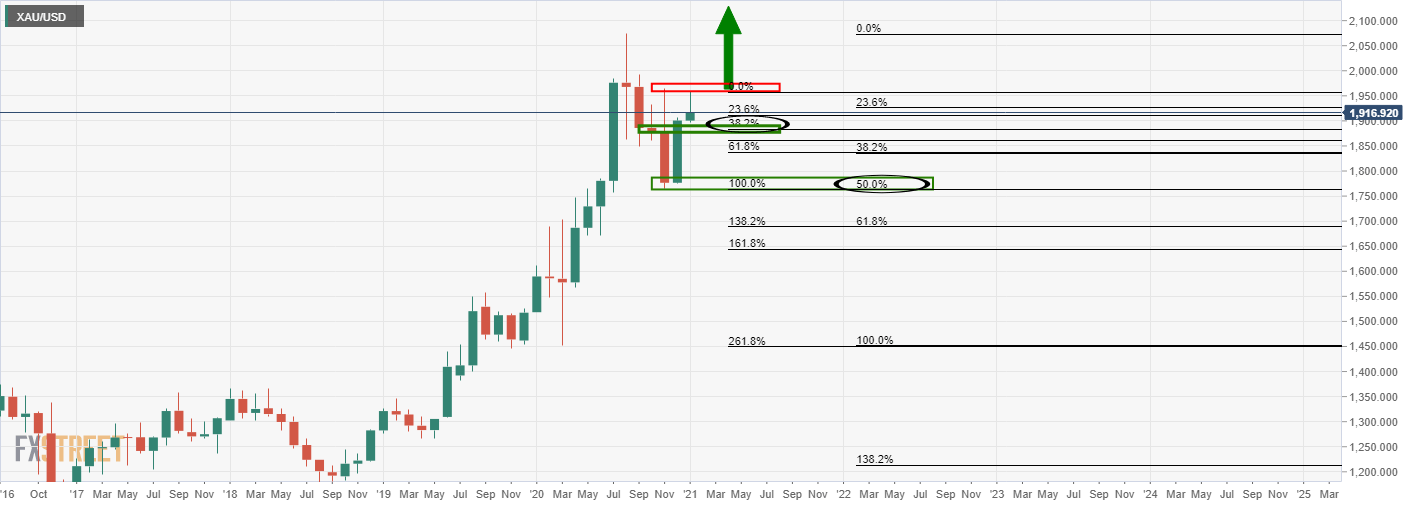
A 38.2% Fibonacci retracement of this current bullish leg’s highs meets prior structure and would be expected to support the pullback from resistance.
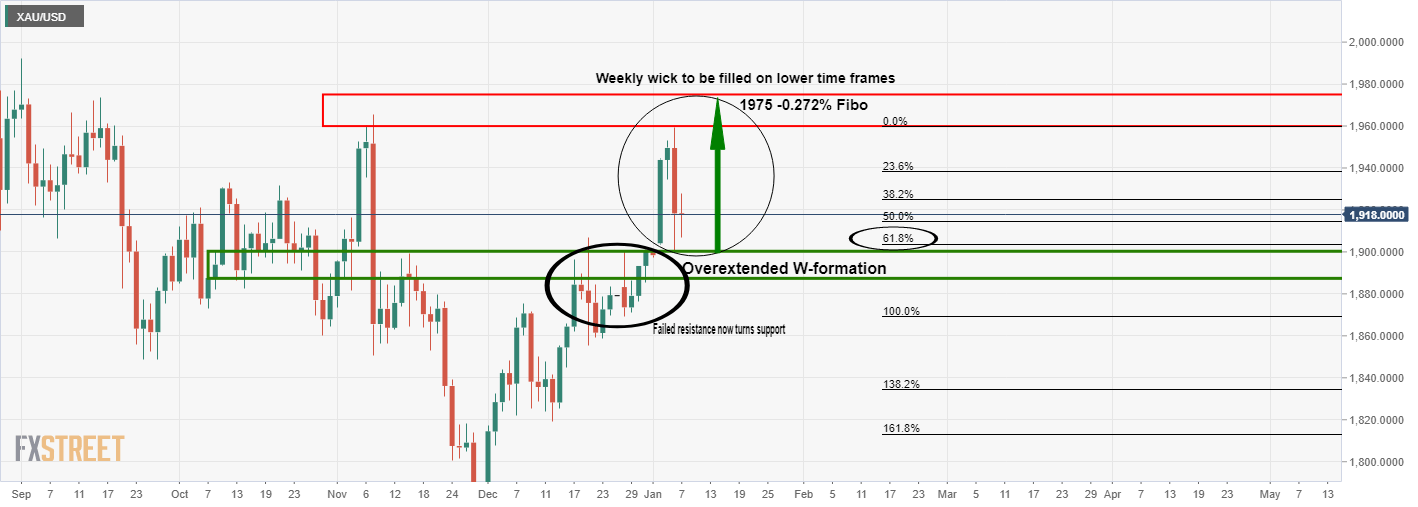
Weekly chart
Meanwhile, the weekly chart’s price rejection from a secondary resistance is leaving a wick that would be expected to be filled on the lower time frames.
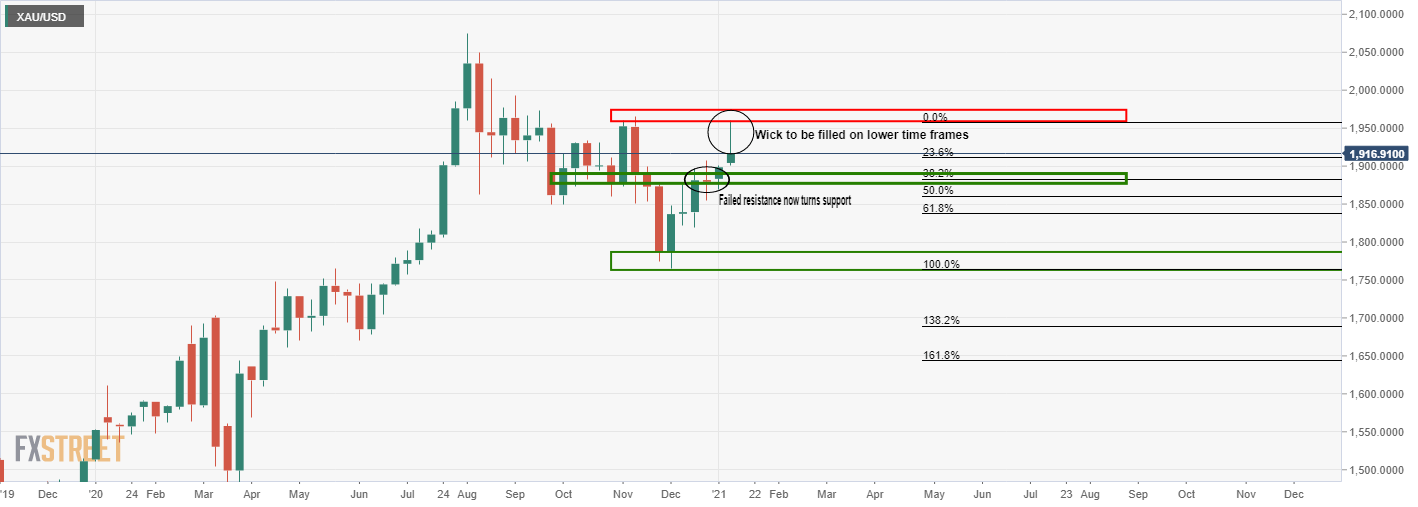
Daily chart
Consequently, the daily chart’s bearish correction of the overextended W-formation’s impulse has stalled at a 61.8% Fibo.
This leaves a bullish bias towards a -0.272% Fibonacci of the correction’s tops to current lows as a target.
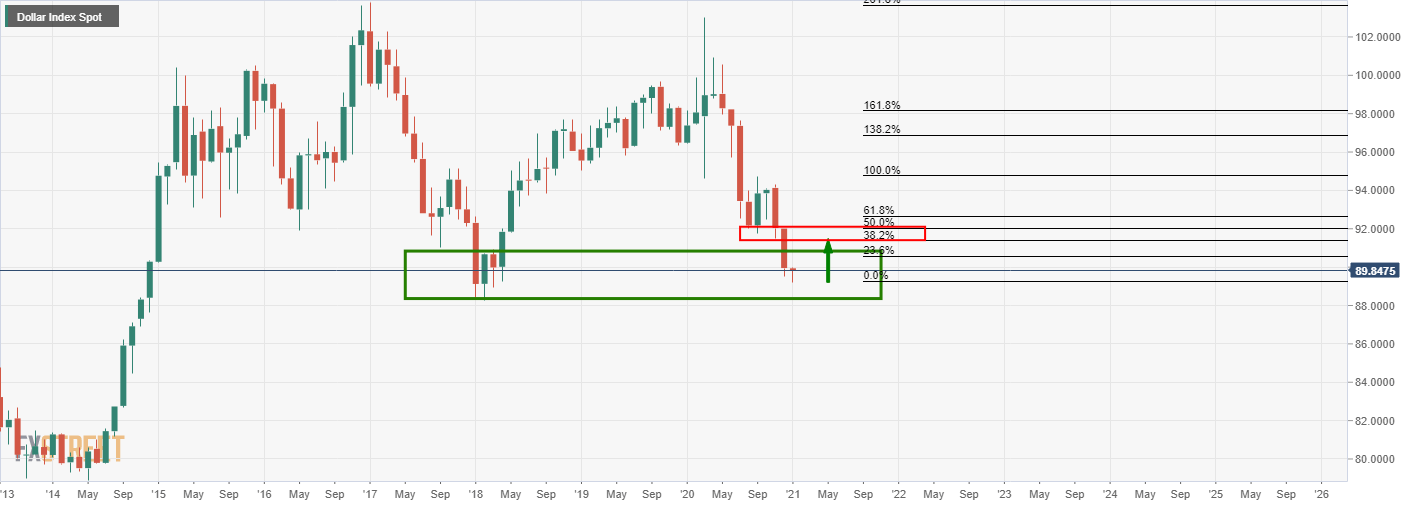
Meanwhile, the price will very much depend on the US dollar’s trajectory.
From a monthly perspective, the greenback is testing a demand area and the path of least resistance could well be to the upside at this juncture.
Therefore, the near term prospects for gold are limited to the upside while the US dollar corrects a significant portion of the monthly trend.
DXY monthly chart