- An uptick in the US bond yields, modest USD strength capped gold near 100-day EMA.
- The recent break through the double-bottom neckline resistance favours bullish traders.
- The XAU/USD seems poised to surpass the $1,800 mark and test the $1,815-16 barrier.
Gold edged higher for the second consecutive session on Wednesday, albeit lacked any follow-through buying and remained capped below the 100-day EMA. The commodity was last seen trading just above the $1,780 level, up around 0.20% for the day.
Renewed fears about another dangerous wave of coronavirus infections in some countries continued weighing on investors’ sentiment and benefitted the safe-haven XAU/USD. However, an uptick in the US Treasury bond yields allowed the US dollar to recover further from multi-week lows and capped gains for the dollar-denominated commodity.
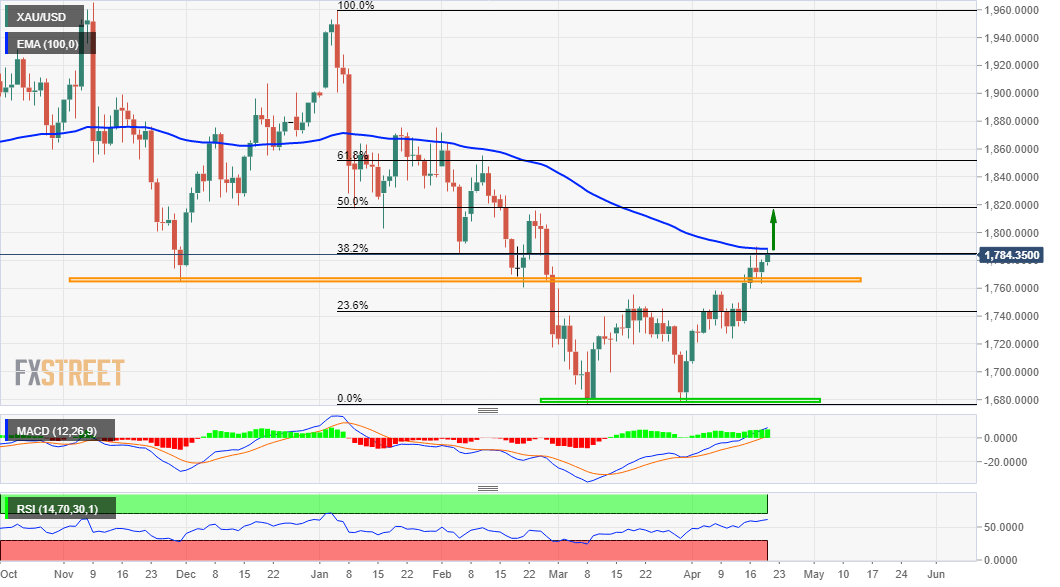
Looking at the technical picture, last week’s move beyond the $1,760-65 hurdle validated a bullish double-bottom formation near the $1,677-76 region. The constructive set-up is reinforced by bullish technical indicators. This, in turn, supports prospects for an eventual break through the mentioned barrier and additional near-term gains.
Hence, a subsequent strength towards the $1,800 mark, en-route the next relevant hurdle near the $1,815-16 area, remains a distinct possibility. The latter coincides with the 50% Fibonacci level of the $1,959-$1,676 downfall, which if cleared decisively will set the stage for an extension of the appreciating move witnessed since early April.
On the flip side, the double-bottom neckline resistance breakpoint, around the $1,765-60 region should now protect the immediate downside. This is followed by support near the 23.6% Fibo. level, around the $1,745-44 area and the $1,730 level. Sustained weakness below will negate the positive outlook and prompt some aggressive technical selling.
The XAU/USD might then turn vulnerable and accelerate the fall towards challenging the $1,700 round-figure mark. Some follow-through selling would expose the double-bottom support, around the $1,677-76 region, or multi-month lows touched in March.
Gold daily chart
Technical levels to watch
