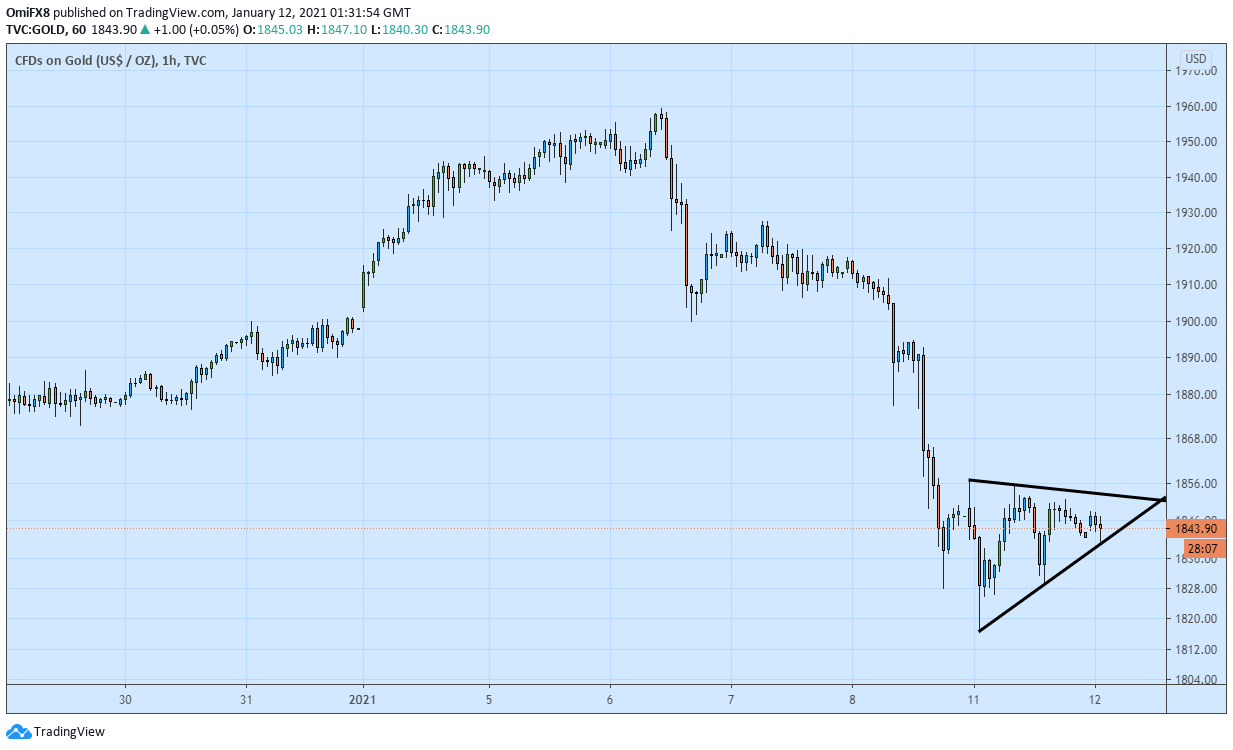
- Gold defends the widely-tracked 200-day SMA support.
- The hourly chart shows a narrowing price range or pennant pattern.
Gold is trading largely unchanged on the day near $1,845 per ounce. The sellers failed to establish a foothold below the 200-day Simple Moving Average (SMA) for the second straight trading day on Monday. The average is currently located at $1,838.
The yellow metal has carved out a pennant pattern on the hourly chart. A downside break would imply a continuation of the sell-off from $1,940 and open the doors to a re-test of Monday’s low of $1,816. A violation there would expose the psychological level of $1,800.
On the other hand, a triangle breakout would validate the seller fatigue signaled by the long tail attached to Monday’s daily candle and allow a bounce to the former support-turned-resistance near $1,870.
Hourly chart
Trend: Neutral
Technical levels

