- Gold trades marginally higher in Asia as US yields decline.
- The metal’s short-duration technical charts show scope for a corrective bounce.
Gold is trading near $1,773 per ounce, having put in a low of $1,765 in early Asia.
The minor bounce could be associated with the US 10-year Treasury yield’s pullback from the 12-month high of 1.55% to 1.5%.
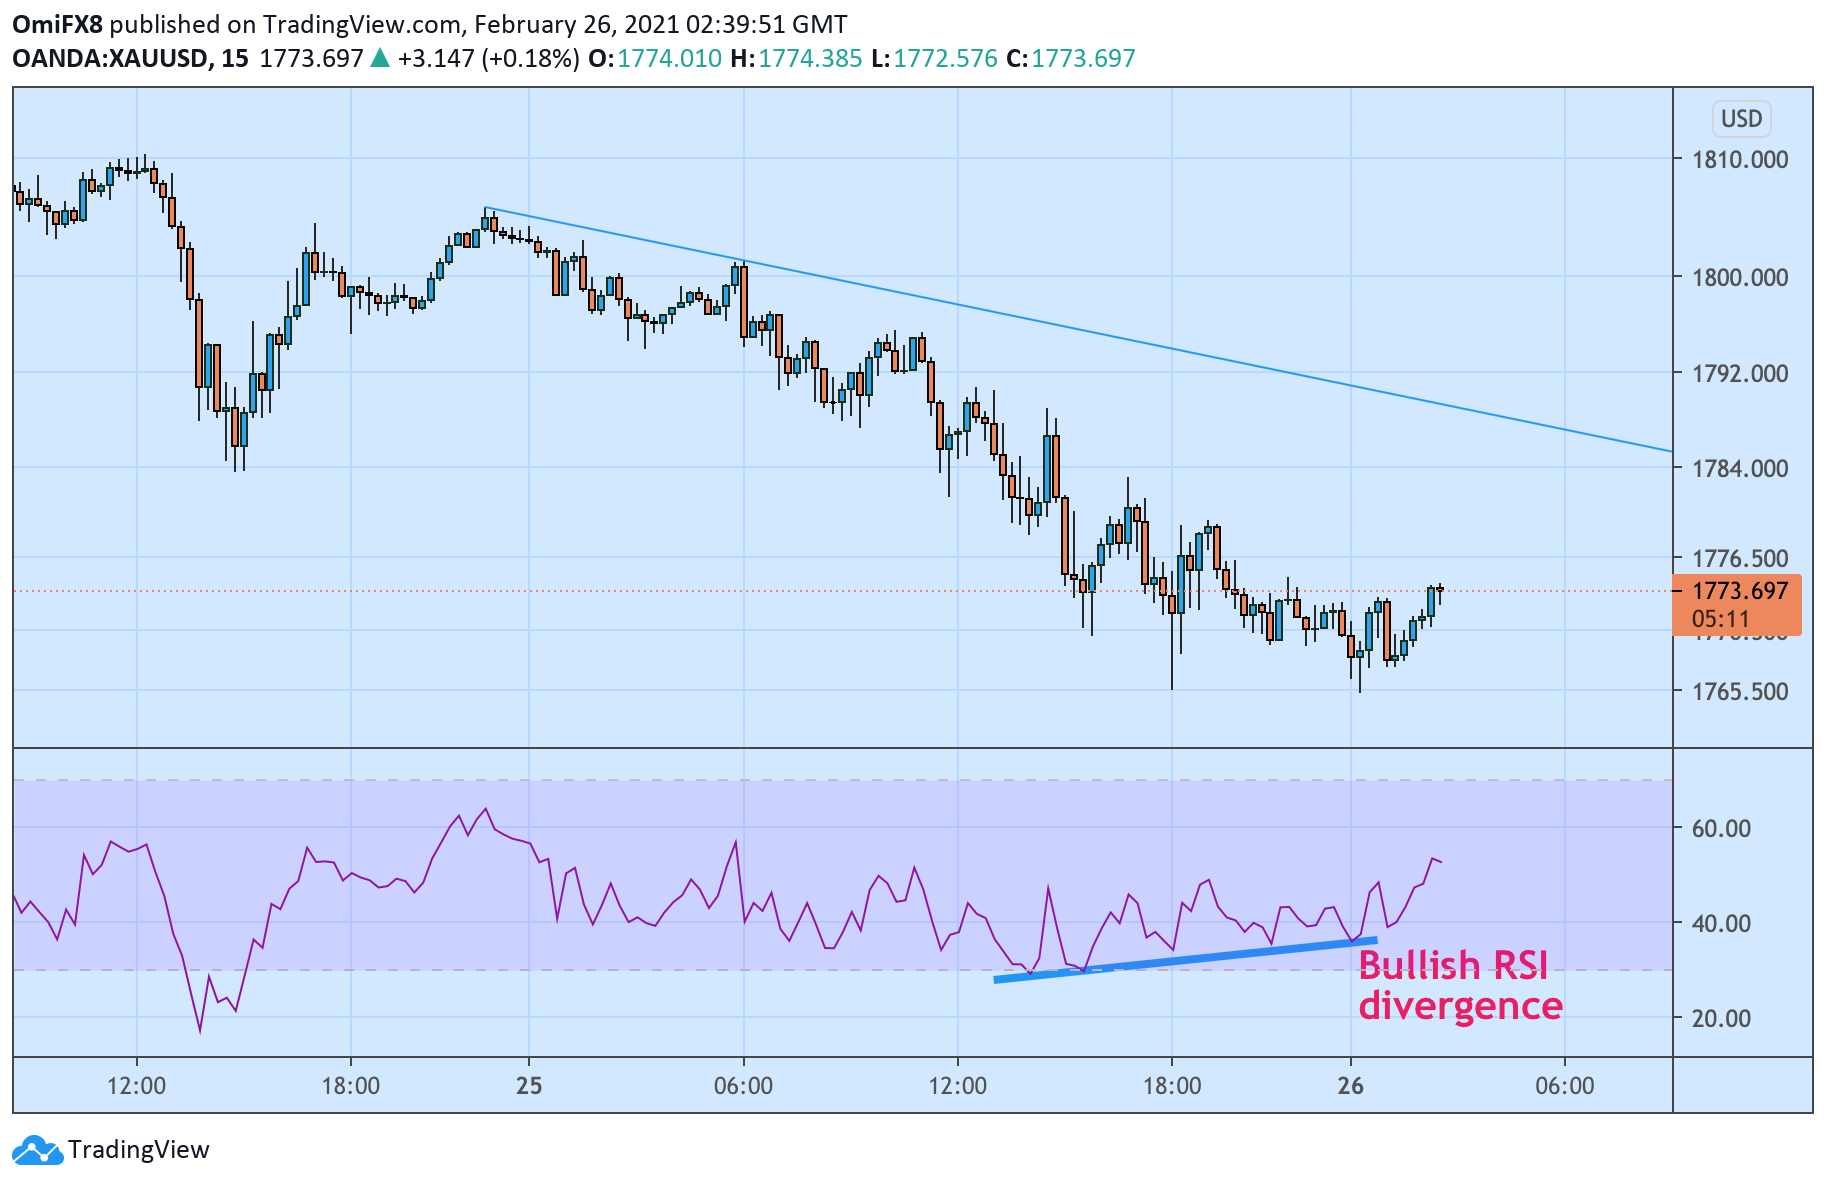
Gold’s 15-minute chart shows a bullish divergence of the Relative Strength Index. Meanwhile, long tail attached to the current and the previous 4-hour candle signals bear fatigue.
As such, the metal could extend the recovery toward resistance at $1,780 – a lower high on the 15-minute chart. A violation there would expose the descending trendline.
The overall bias would remain bearish while prices are held under the Feb. 23 high of $1,816.
15-minute chart
Trend: Corrective bounce
Technical levels
