- XAU/USD is in consolidation mode after suffering its worst weekly decline since 1983 the week before.
- Sideways price action can be expected in the short term.
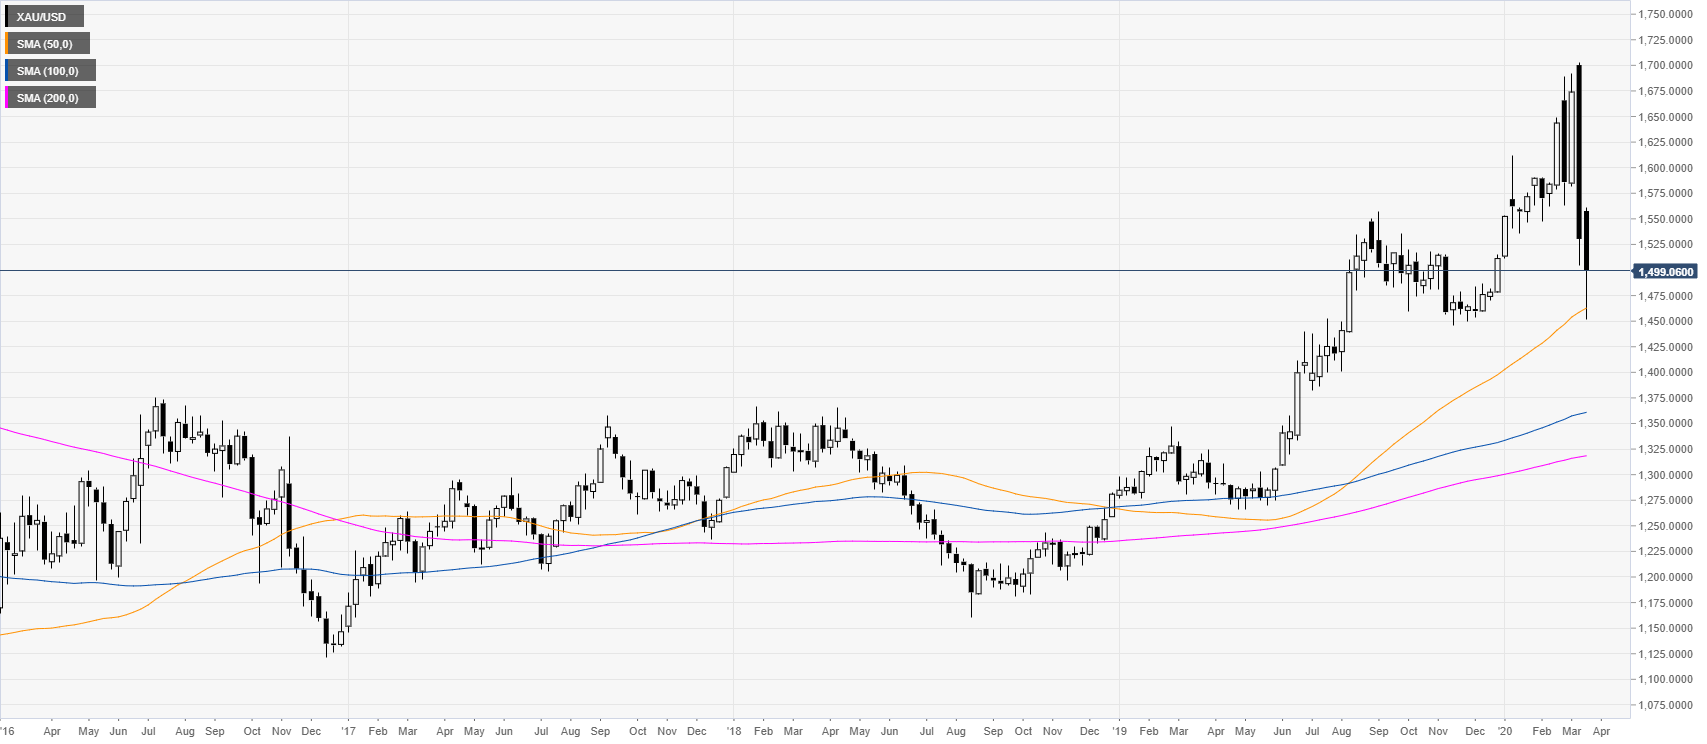
XAU/USD weekly chart
Last week, gold registered the worst weekly decline since 1983, erasing the early 2020 spike up while now challenging the 50 WMA (weekly simple moving average) on the weekly chart. XAU/USD keeps consolidating losses near $1500 per troy ounce.
XAU/USD four-hour chart
A consolidation is taking place following the selloff as the metal is trading well below its main SMAs suggesting an overall bearish momentum in the medium term. The metal remains vulnerable to the downside to the1488, 1477 and 1460 levels which bulls might attempt to defend. On the flip side, bullish attempts could lose steam near 1505, 1520 and 1540 price levels.
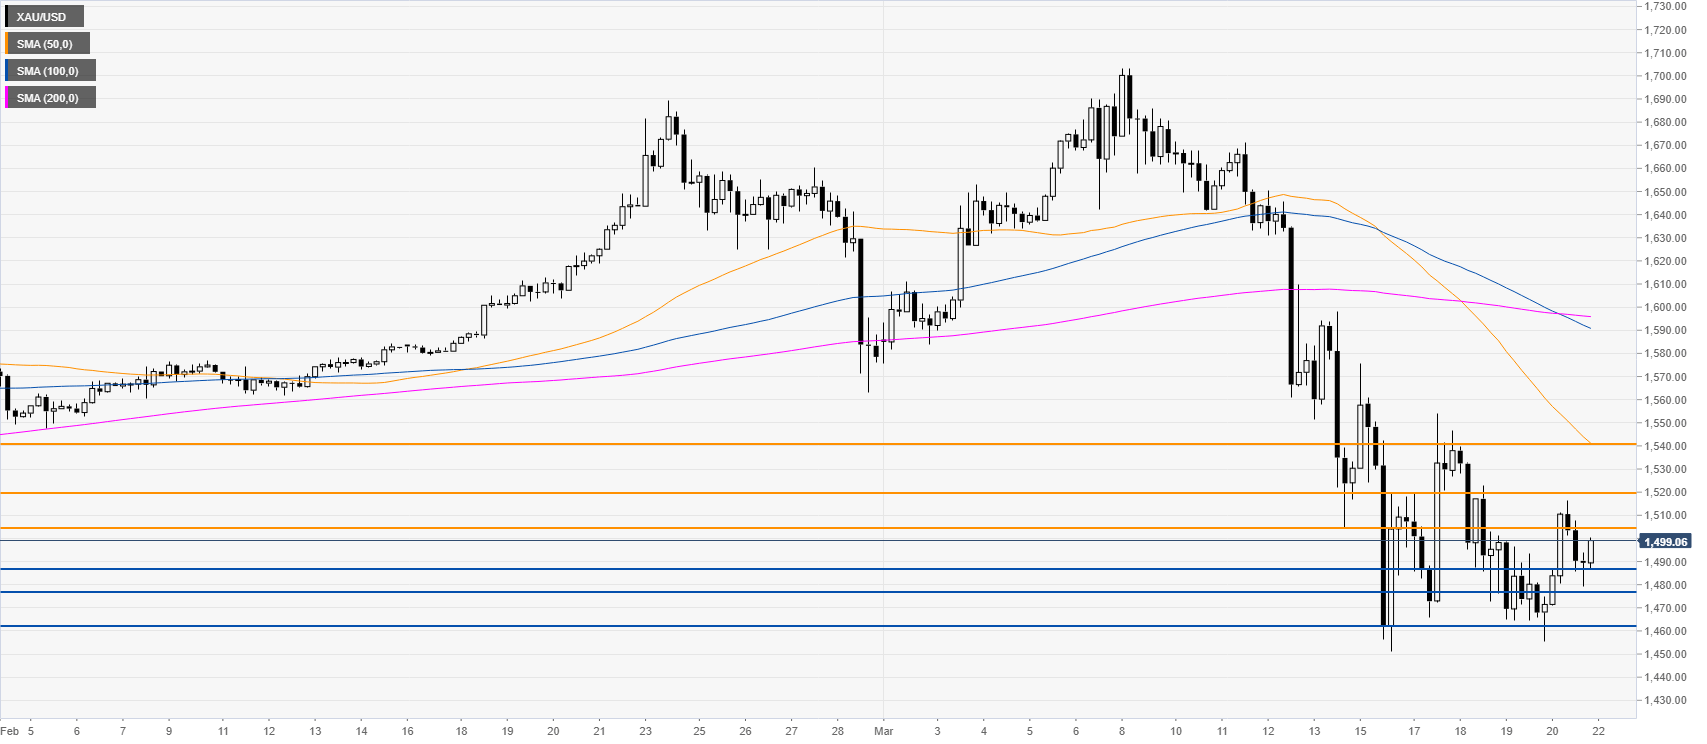
Resistance: 1505, 1520, 1540
Support: 1488, 1477, 1460
Additional key levels
