Gold prices keep bounce off the fresh low since December 01, marked earlier in Asia, while picking up the bids around $1,830, up 0.20% intraday, during the pre-European session trading on Monday. The yellow metal initially had to respect the US dollar’s run-up before bouncing off the key support.
Off in the US and a light calendar in Asia, except for China’s mixed activity numbers, restrict the bullion’s moves while challenges for the US President-elect Joe Biden and company join the coronavirus (COVID-19) worries to heavy the risks.
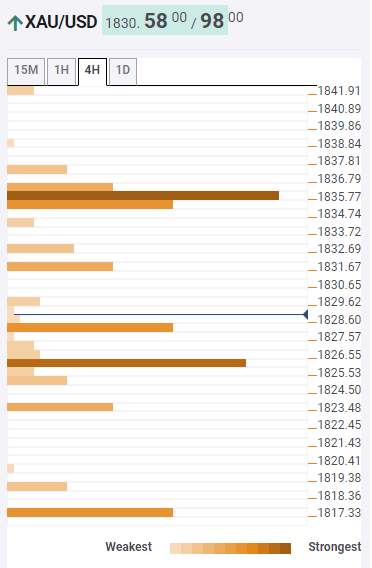
Gold: Key levels to watch
A sustained break of $1,826/27 confluence comprising the middle band of the Bollinger Band on the 15-minute chart as well as SMA 5 on the hourly chart favors the intraday gold buyers.
However, 38.2% Fibonacci retracement of one day move (1D) near $1,836 becomes a tough nut to crack for the bulls.
Meanwhile, 23.6% Fibonacci retracement of one week move (1W) around $1,828 offers immediate support before highlighting the $1,827/26 area for sellers.
Should gold sellers dominate past-$1,826, the previous week’s low around $1,817 can return to the charts.
Here is how it looks on the tool
About Confluence Detector
The TCI (Technical Confluences Indicator) is a tool to locate and point out those price levels where there is a congestion of indicators, moving averages, Fibonacci levels, Pivot Points, etc. Knowing where these congestion points are located is very useful for the trader, and can be used as a basis for different strategies.
Learn more about Technical Confluence
