- Gold bulls defend support of Friday’s low of $1,897.
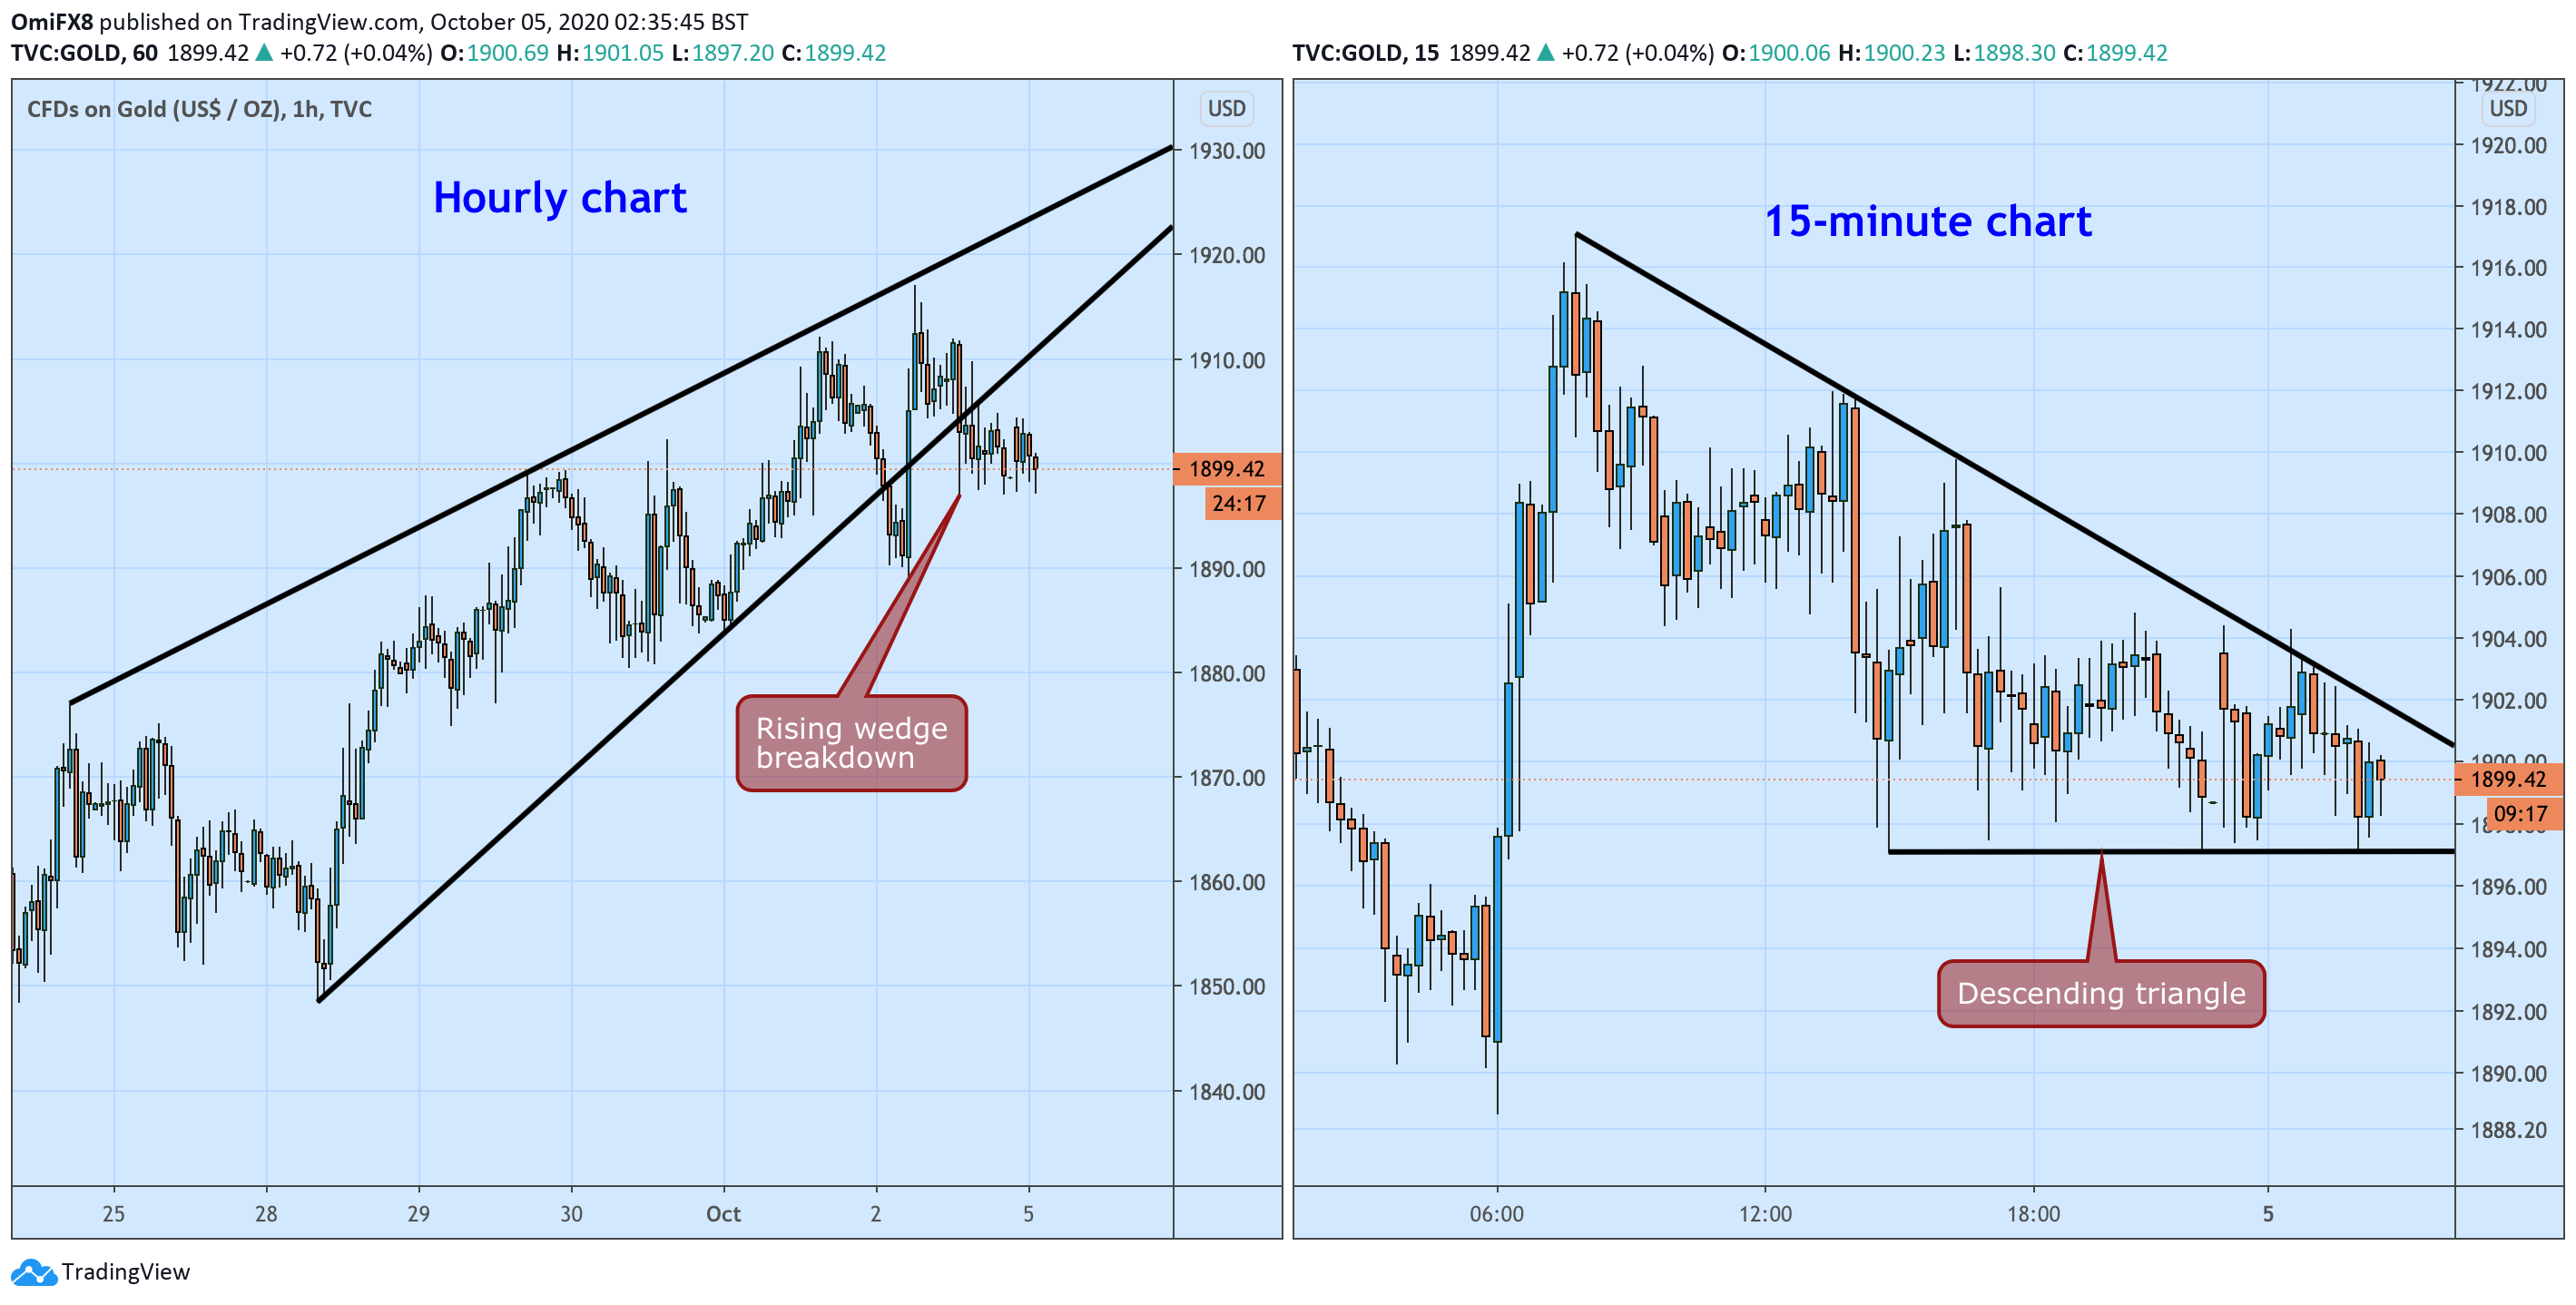
- The yellow metal is trapped in a descending triangle on the 15-minute chart.
While gold (XAU/USD) has bounced up from Friday’s low of $1,897, the yellow metal is still trapped in a descending channel, as seen on the 15-minute chart.
A move above the top end of the triangle, currently at $1,903, would confirm a breakout and open the doors for the Oct. 2 high of $1,917.
Alternatively, acceptance below $1,897 – the lower end of the triangle – would reinforce the bearish view put forward by the hourly chart rising wedge breakdown confirmed on Friday and expose the 100-day SMA at $1,855.
At press time, gold is trading at $1,900 per ounce.
Hourly and 15-min charts
Trend: Neutral
Technical levels
