Gold (XAU/USD) continues to feel the pull of gravity and closes in on the critical $1900 support. The narrative of reflation trades plays out, driving Treasury yields higher on expectations of higher fiscal stimulus by the Biden administration.
The Fed’s view on rising inflation expectations also backs the upside in the US rates, weighing on the yieldless gold. Higher yields could continue to support the US dollar’s rebound, as markets digest encouraging Pfizer’s coronavirus vaccine news.
All eyes now turn towards the US payrolls release for fresh direction on the yellow metal. How is gold positioned on the charts heading into the critical US jobs data.
Gold Price Chart: Key resistances and supports
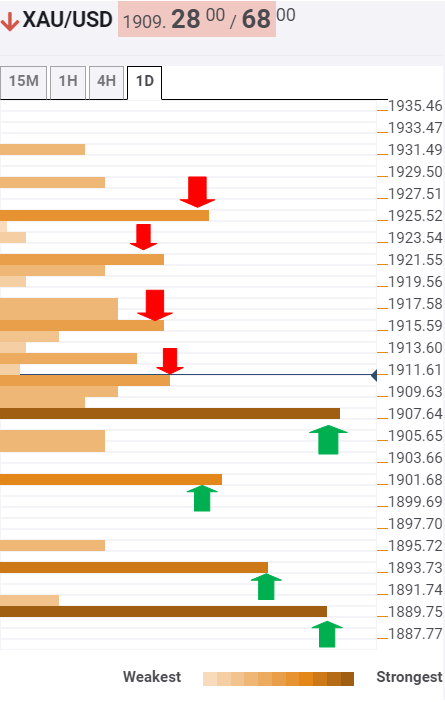
The Technical Confluences Indicator shows that gold is threatening strong support at $1908, which is a confluence of the previous month high and the previous day low.
A breach of the last could expose the critical $1900 support zone, the intersection of the previous week high and Bollinger Band four-hour lower.
Further south, the sellers could challenge the meeting point of the Fibonacci 23.6% one-week and SMA100 one-day at $1894.
The last reprieve for the XAU bulls is seen at $1890, the Fibonacci 38.2% one-week, below which the upbeat momentum could be negated.
On the flip side, $1911 poses an immediate resistance for gold, which is the pivot point one-week R1.
The next relevant hurdle awaits around $1916/17 region, the confluence zone of the Fibonacci 38.2% one-day, SMA5 four-hour and the previous high on four-hour.
The buyers will then target the pivot point one-week R2 at $1920. Acceptance above the latter could bring the $1925 back in play.
That level is the convergence of the SMA5 one-day and pivot point one-day R1.
Here is how it looks on the tool
About Confluence Detector
The TCI (Technical Confluences Indicator) is a tool to locate and point out those price levels where there is a congestion of indicators, moving averages, Fibonacci levels, Pivot Points, etc. Knowing where these congestion points are located is very useful for the trader, and can be used as a basis for different strategies.
Learn more about Technical Confluence
