Gold (XAU/USD) is advancing above the 200-day SMA, as the US inflation expectations continue to rise, in anticipation of a massive stimulus package under the incoming Biden administration. Stimulus expectations boost gold’s appeal as an inflation-hedge while downing the safe-haven US dollar.
Treasury Secretary nominee Janet Yellen’s backed President-elect Biden’s view for higher fiscal spending, noting that its benefits outweigh the expenses of a higher debt burden. Biden’s inauguration speech is eagerly awaited for fresh hints on the stimulus plan.
How is gold positioned on the technical charts?
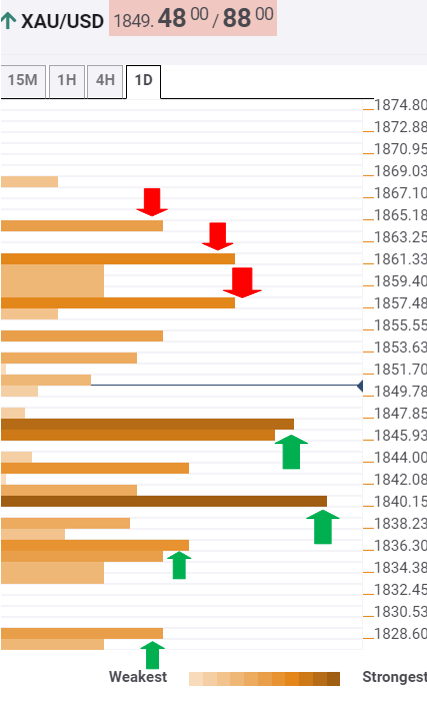
Gold Price Chart: Key resistances and supports
The Technical Confluences Indicator shows that gold has some additional room to the upside, with the immediate resistance seen at $1858. That level is the confluence of the SMA10 one-day and Fibonacci 38.2% one-month.
After crossing a dense cluster of mino9r resistance levels, the XAU bulls may run through strong offers at $1860/62, which is the SMA50 one-day.
The previous week high at $1864 is the level to beat for the gold buyers.
On the flip side, acceptance under the critical support around $1847/46 is needed to invalidate the recovery momentum. The Fibonacci 61.8% one-week intersects with the SMA200 one-day and the previous day high at that point.
The next relevant support awaits at $1840, which is the convergence of the SMA10 four-hour, SMA5 one-day and the previous low four-hour.
The sellers will then target the Fibonacci 38.2% one-week at $1835, below which the $1829 (Fibonacci 23.6% one-week) support will challenge the bears’ commitment.
Here is how it looks on the tool
About Confluence Detector
The TCI (Technical Confluences Indicator) is a tool to locate and point out those price levels where there is a congestion of indicators, moving averages, Fibonacci levels, Pivot Points, etc. Knowing where these congestion points are located is very useful for the trader, and can be used as a basis for different strategies.
