Gold has been hit hard by upbeat US data. Markit’s Purchasing Managers’ Indexes have shown robust growth prospects, thus lowering the chances for additional fiscal and monetary stimulus. Without hopes for a fresh injection of funds, traders sold off the precious metal.
As more economic figures are awaited, how is XAU/USD positioned on the technical charts?
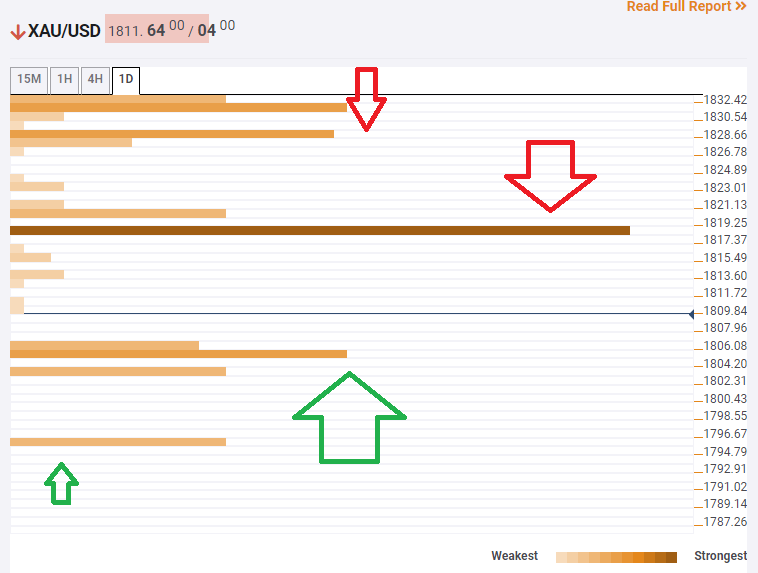
The Technical Confluences Indicator is showing that gold’s next downside target is $1,805, which is the convergence of the Pivot Point one-week Support 3, the previous 4h-Low, and the PP one-day S2.
Looking down, the next cushion is already below the $1,800 level. The all-important 200-day Simple Moving Average awaits at around $1,795.
Resistance awaits the yellow metal at around $1,818, which is the confluence of the PP one-month S2, the Bollinger Band 4h-Lower, and the SMA 10-15m.
Further above, $1,828 serves as an upside target. It is a juncture of lines including the PP one-week S2, the SMA 5-4h, and the BB 1h-Middle.
Key XAU/USD resistances and supports
Confluence Detector
The Confluence Detector finds exciting opportunities using Technical Confluences. The TC is a tool to locate and point out those price levels where there is a congestion of indicators, moving averages, Fibonacci levels, Pivot Points, etc. Knowing where these congestion points are located is very useful for the trader, and can be used as a basis for different strategies.
Learn more about Technical Confluence
