- The 2019 bullish run is continuing at the very start of 2020.
- The level to beat for bulls is the 1560/1600 price zone.
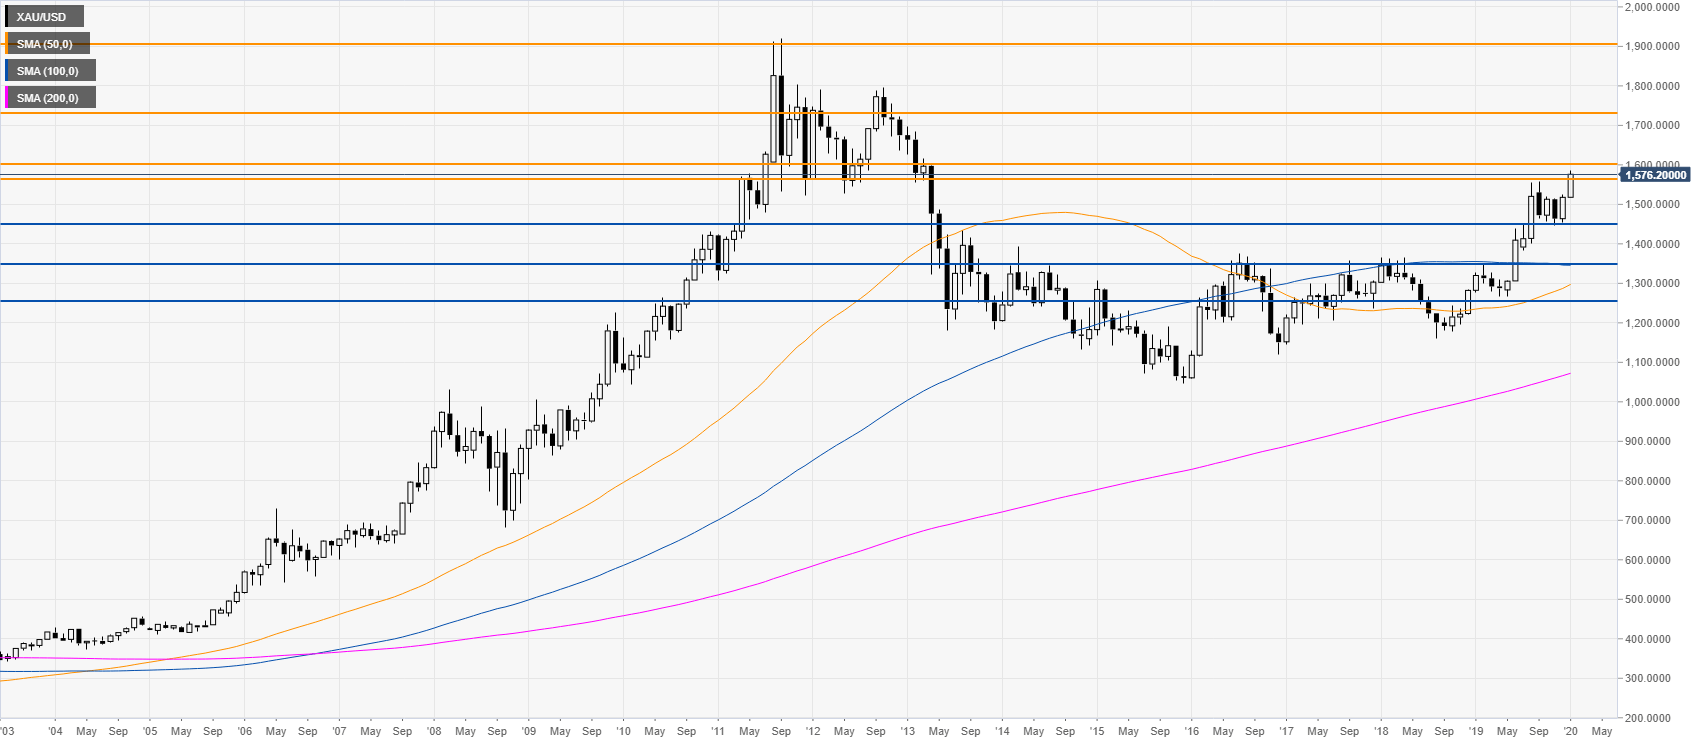
Gold monthly chart
The metal is trading in a bull trend above the main monthly simple moving averages (SMAs). The market is attempting to have a convincing breakout above the 1560/1600 price zone. If the buyers overcome this resistance zone, gold has room to climb to the 1730 and 1900 resistance levels.
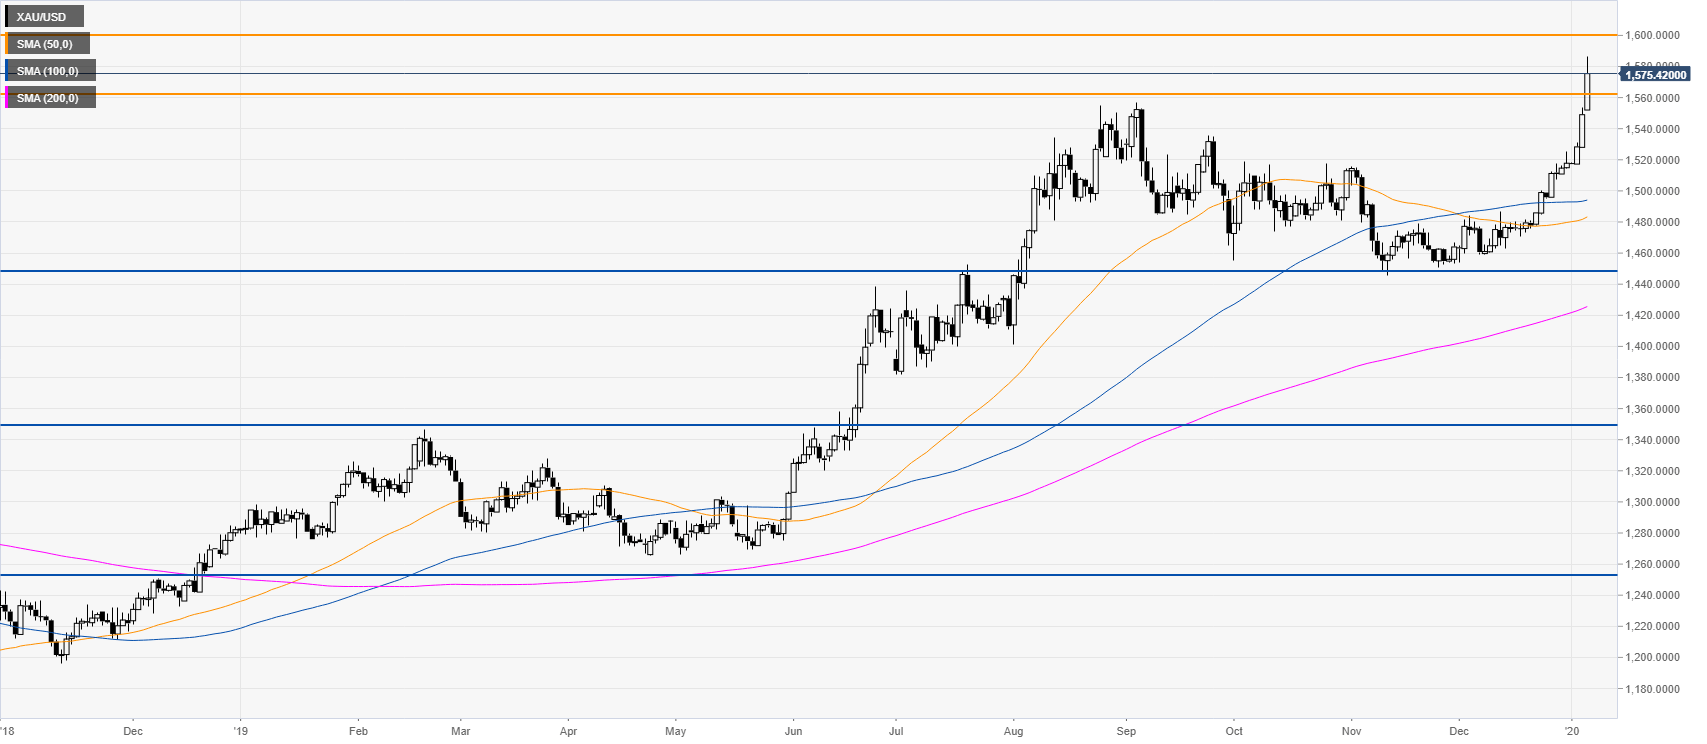
Gold daily chart
On the flip side, if the bulls fail to overcome the 1560/1600 resistance zone and it gets faded, the metal could revisit 1445 support and potentially correct down and test the 1350 and 1250 levels.
Additional key levels
