- Gold teases a bullish breakout with a move to near two-month highs.
- Major resistance is now located above $1,960, according to the daily chart.
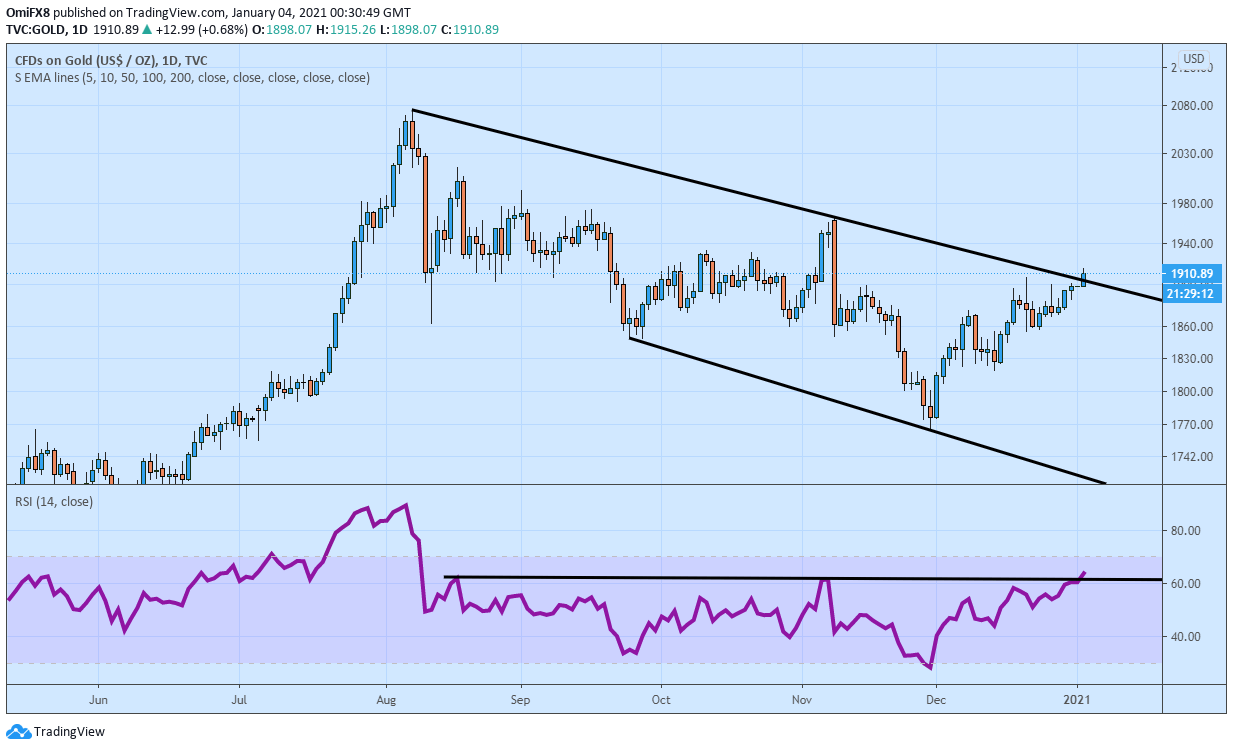
Gold is trading at $1,915 per ounce at press time. That’s the highest level in nearly two months.
The daily chart shows the metal is breaking out of a five-month falling channel represented by trendlines connecting Aug. 7 and Nov. 9 highs and Sept. 24 and Nov. 30 lows.
A daily close above $1,904 would confirm the bullish breakout and open the doors for $1,965 (Nov. 9 high). The 14-day Relative Strength Index (RSI) has already breached resistance at 62.00 in favor of the bulls.
The bias would turn bearish if the higher low of $1,857 created on Dec. 23 is breached.
Daily chart
Trend: Bullish
Technical levels
