- Gold’s 50-day SMA support at $1,908 stands exposed.
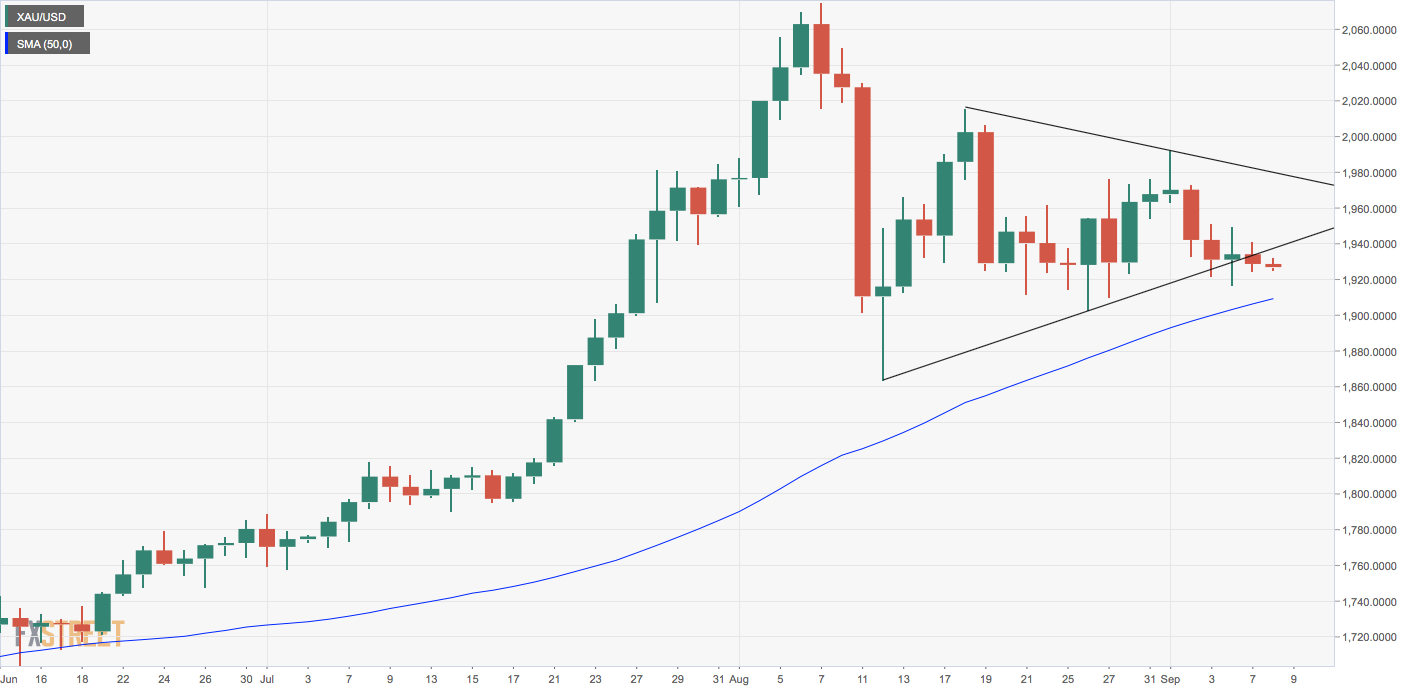
- The daily chart shows a symmetrical triangle breakdown.
Gold fell by 0.18% on Monday, confirming a symmetrical triangle breakdown on the daily chart.
The pattern indicates the two-week-long price consolidation has ended, and the pullback from the record high of $2,075 reached on Aug. 7 has resumed.
As such, the yellow metal risks falling to the 50-day simple moving average support at $1,908 – the average last put to the test on June 18.
Supporting the bearish case is the below-50 reading on the 14-day relative strength index and the negative reading on the MACD histogram.
At press time, gold is trading at $1,926 per ounce, representing a 0.16% decline on the day.
Daily chart
Trend: Bearish
Technical levels
