- Gold eyes first test of the 200-day SMA since March.
- The metal risks closing below the long-term SMA support.
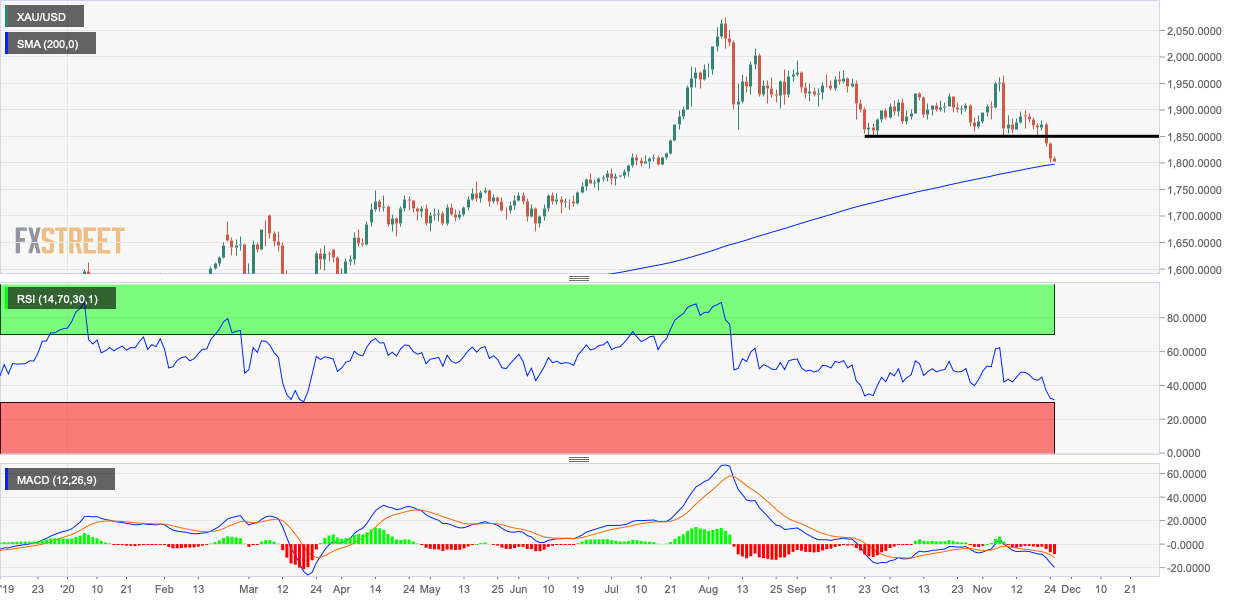
At the current price of $1,804 per ounce, gold is trading quite close to the widely-followed 200-day Simple Moving Average (SMA) of $1,797.
The safe-haven metal is about to test the long-term SMA for the first time since March.
A break below that support cannot be ruled out, as the 14-day Relative Strength Index (RSI) is reporting bearish conditions with a below-50 print. Further, MACD histogram, an indicator used to gauge trend strength and trend changes, is charting deeper bars below the zero line, indicating a strengthening of the bearish momentum.
A close below the 200-day SMA would shift the focus to $1,765 (May 18 high). On the higher side, the former support-turned-hurdle of $1,850 is the level to beat for the bulls.
The metal dived below the long-held floor of $1,850 earlier this week, signaling a resumption of the decline from the record high of $2,075 reached in August.
Daily chart
Trend: Bearish
Technical levels
