- Gold price holds gains above $1900, four-month highs.
- Rising inflation concerns, dovish Fed continue to pressure DXY, yields.
- Gold Price Forecast: XAU/USD breaks through $1900, room for additional upside?
Gold price entered a bullish consolidation phase after refreshing four-month highs above $1900 this Wednesday. Broad-based rebound in the US dollar appears to cap the additional upside in gold. The greenback recovers from the weaker US data and Fed’s dovish stance-led sell-off. Despite a minor retreat, the bullish undertone in gold price remains intact amid growing inflation concerns, as the Fed continues to dismiss rising price pressures. Further, renewed weakness in the Treasury yields combined with mixed tone in the global stocks continues to support gold price.
Looking ahead, all eyes remain on the Fedspeak, as the US data calendar remains light. Attention also turns towards the US Preliminary GDP, Consumer Durable Goods data and Fed’s preferred inflation gauge for fresh directives.
Watch: Gold price surges past $1,900 – Is $2,000 the next stop? [Video]
Gold Price: Key levels to watch
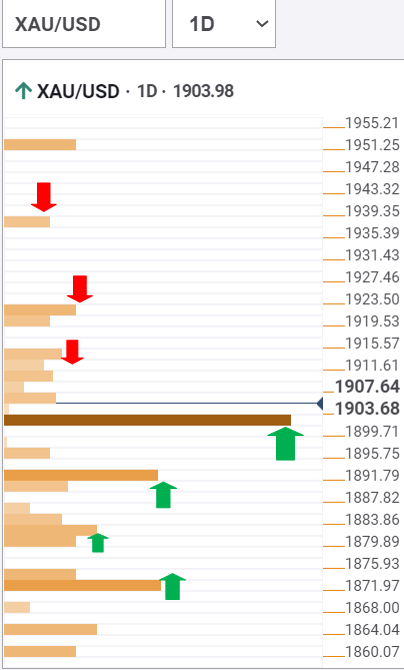
The Technical Confluences Detector shows that gold price has taken out a powerful resistance at $1900, which is the convergence of the previous day high, pivot point one-week R1 and pivot point one-month R3.
The next target for gold bulls is aligned around $1913, where the Bollinger Band one-day Upper meets the pivot point one-day R1.
The pivot point one-week R2 at $1920 will test the bullish commitments going forward.
A sustained move above the latter could trigger a fresh upswing towards $1937, the pivot point one-day R3.
Meanwhile, if the abovementioned resistance now support at $1900 gives way, a drop towards the previous week high and SMA10 four-hour at $1890 cannot be ruled out.
Gold sellers could then challenge the $1880 demand area, the intersection of the pivot point one-day S1 and SMA5 one-day.
The last line of defense for bulls is seen at $1870, where the Fibonacci 38.2% one-week coincides with the SMA200 one-hour.
Here is how it looks on the tool
About Technical Confluences Detector
The TCD (Technical Confluences Detector) is a tool to locate and point out those price levels where there is a congestion of indicators, moving averages, Fibonacci levels, Pivot Points, etc. If you are a short-term trader, you will find entry points for counter-trend strategies and hunt a few points at a time. If you are a medium-to-long-term trader, this tool will allow you to know in advance the price levels where a medium-to-long-term trend may stop and rest, where to unwind positions, or where to increase your position size.
