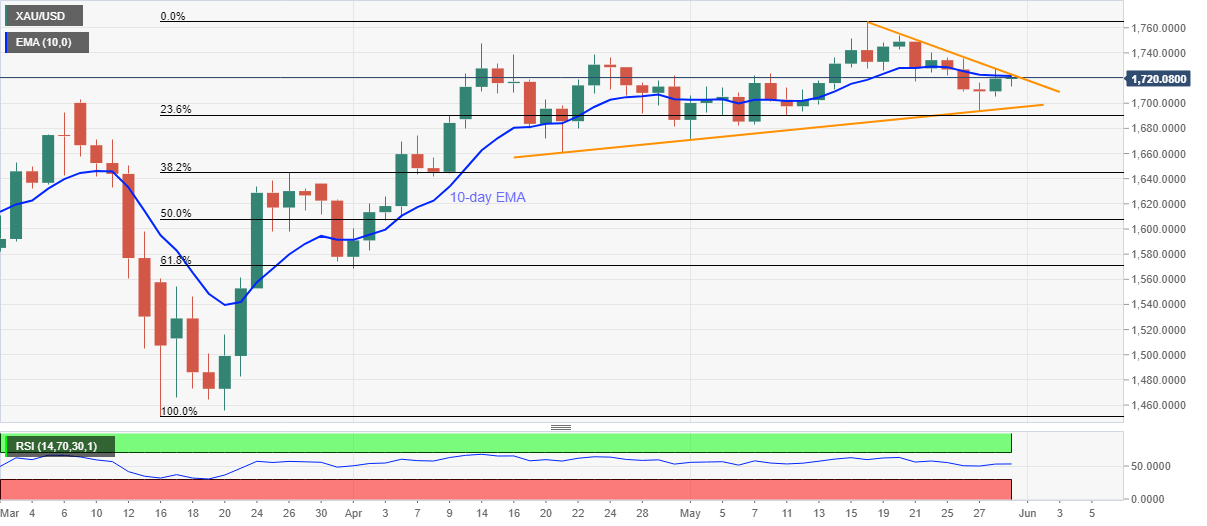
- Gold prices extend the latest recovery from $1,711 as DXY refreshes two-month low.
- A confluence of 10-day EMA, nine-day-old falling trend line probes immediate upside.
- An ascending trend line from April 21 favors the bulls.
Gold prices remain mildly bid around $1,721 ahead of the European open on Friday. In doing so, the bullion confronts a short-term key resistance while stretching the pullback moves from a five-week-old support trend line.
Considering the normal RSI conditions and the strength of the risk-aversion wave, amid the US-China tussle, the precious metal is expected to break the $1,721/23 resistance confluence.
In doing so, April month’s top surrounding $1,748 could be on the bulls’ radars before targeting to refresh the monthly top near $1,765.38.
On the flip side, a month-long support line, at $1,696 now, could keep the near-term downside limited.
In a case where the bullion flashes a daily close below $1,696, April 21 bottom near $1,661 could return to the chart.
Gold daily chart
Trend: Bullish
