Gold (XAU/USD) holds below the critical $1947 barrier heading into Tuesday’s runoff elections in Georgia. Gold buyers remain hopeful of Democratic control of Congress, as it implies an easier path for President-elect Joe Biden to push for additional fiscal support.
An increase in inflows into gold ETFs combined with a surge in coronavirus cases-led fresh lockdowns also keeps the metal underpinned. Let’s look at the key technical levels for trading gold in the lead up to the critical Georgia vote.
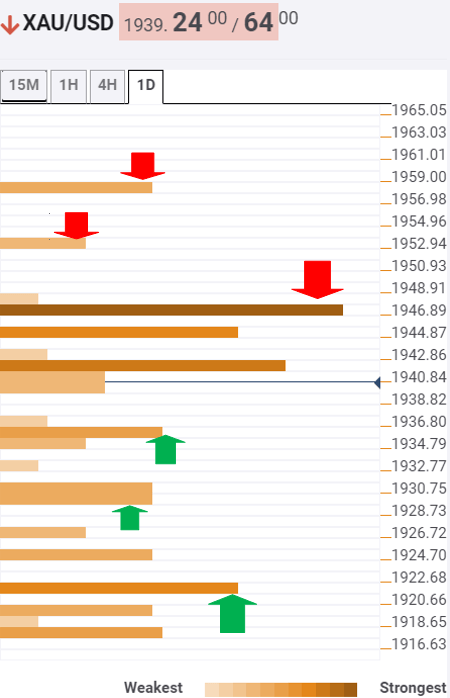
Gold Price Chart: Key resistances and supports
The Technical Confluences Indicator shows that Monday’s 2% rally remains capped below the critical $1947 resistance, which is the pivot point one-month R1.
Only a sustained break above the latter could unleash the further upside, with immediate resistance aligned at $1952, the Bollinger Band four-hour Upper.
The next upside target for the buyers is seen at $1958, where the pivot point one-day R1.
Alternatively, the convergence of the Fibonacci 23.6% one-day and SMA100 15-minutes at $1935 could challenge the retracement from two-week tops.
Further south, the $1929 cushion could limit the declines. That level is the Fibonacci 38.2% one-day.
Meanwhile, strong support of the pivot point one-week R2 at $1921 will be the level to beat for the bears.
Here is how it looks on the tool
About Confluence Detector
The TCI (Technical Confluences Indicator) is a tool to locate and point out those price levels where there is a congestion of indicators, moving averages, Fibonacci levels, Pivot Points, etc. Knowing where these congestion points are located is very useful for the trader, and can be used as a basis for different strategies.
Learn more about Technical Confluence
