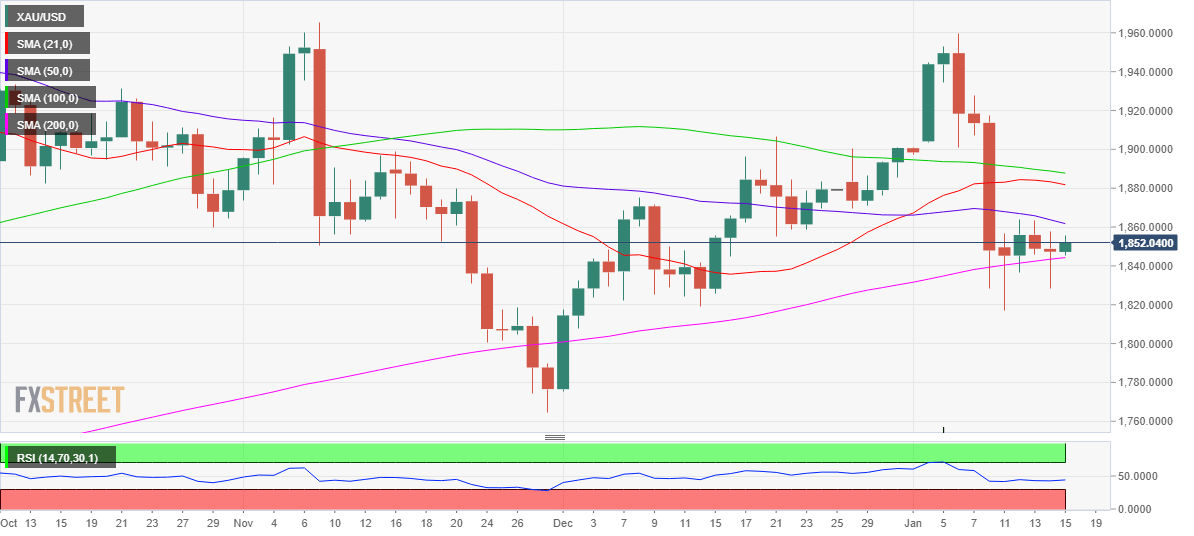
- Gold awaits US data for a clear direction
- 50-DMA caps the upside, 200-DMA offers strong support.
- Daily RSI trades flat but in the bearish region.
Gold (XAU/USD) trades on the front foot this Friday amid dovish comments from the Fed Chief Powell.
However, gold’s further upside remains elusive, as the safe-haven demand for the US dollar is on the rise, with markets uncertain about the details of President-elect Joe Biden’s $1.9 stimulus package unveiled earlier in the Asian session.
Investors also turn cautious ahead of the critical US Retail Sales, especially after Thursday’s disappointing weekly Jobless Claims.
At the time of writing, gold trades at $1852.40, up 0.29% on the day, having found dip-demand at lower levels earlier this week.
Gold Price Chart: Daily
As observed in the daily chart, gold remains locked in a familiar range so far this week, with the upside attempts capped by the bearish 50-daily moving average (DMA), now at $1862.
Meanwhile, the upward-sloping 200-DMA at $1844 keeps the buyers hopeful. However, a sense of caution prevails, as the 14-day Relative Strength Index (RSI) still trends in the bearish region, now at 44.18.
The next relevant support is seen at Thursday’s low of $1829, below which the January 11 low of $1817 could be challenged.
Alternatively, acceptance above the 50-DMA hurdle could open doors for a test of the 21-DMA at $1882. Further up, the 100-DMA at $1888 would be on the buyers’ radars.
Gold Additional levels

