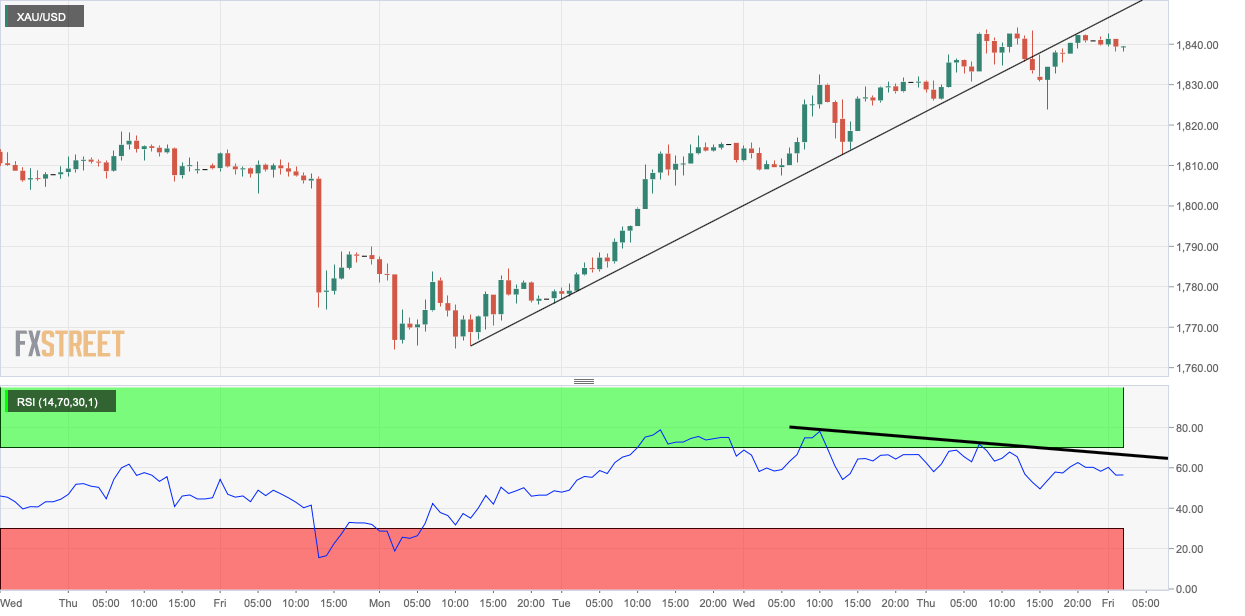
- Gold’s hourly chart shows a bearish divergence of RSI.
- The metal could snap its three-day winning streak.
Gold gained over 0.5% to $1,840 per ounce on Thursday, confirming a three-day winning streak and erasing more than 505 of the previous week’s decline from $14,869 to $1,774.
However, the recovery rally could run out of steam, as the hourly chart has violated the trendline rising from recent lows. Further, the hourly chart Relative Strength Index has created lower highs, contradicting higher highs on the price chart. The bearish divergence indicates the bounce from the previous week’s low has run out of steam.
The hourly chart shows immediate support is located at $1,823. A violation there would expose the 5-day Simple Moving Average at $1,819. On the higher side, resistance is seen at $1,850. The metal is currently trading at $1,838 per ounce.
Hourly chart
Trend: Bearish
Technical levels
