Stimulus and gold do not seem to go together with that well – and rising yields can be blamed for that. President Joe Biden’s infrastructure plans imply not only higher inflation but an increase in borrowing. With the Treasury issuing more bonds, their value decreases, and returns on US debt rises. In turn, that means that returns on safe assets are more attractive – making the yieldless yellow metal less so.
XAU/USD slipped below $1,700. How is it now positioned on the charts?
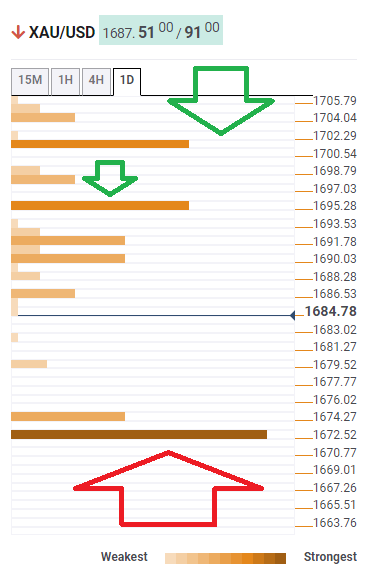
How is XAU/USD positioned on the charts?
The Technical Confluences Detector is showing that gold faces significant resistance at $1,695, which is the convergence of the Pivot Point one-week Support 3 and the Bollinger Band 15min-Middle.
The upside target for the yellow metal is at $1,701, which is the meeting point of the PP one-day Support 1, the previous 4h-high, and the Simple Moving Average 50-15m.
Despite the recent recovery, significant support awaits only at $1,672, which is the confluence of two Pivot Points – the one-month Support 1 and the one-day Support 3.
XAU/USD resistance and support levels
Confluence Detector
The Confluence Detector finds exciting opportunities using Technical Confluences. The TC is a tool to locate and point out those price levels where there is a congestion of indicators, moving averages, Fibonacci levels, Pivot Points, etc. Knowing where these congestion points are located is very useful for the trader, and can be used as a basis for different strategies.
Learn more about Technical Confluence
