- Core Retail Sales from July dropped to-0.4% against the expected 0.2% and weighed on the US dollar.
- Afghan government’s failure encourages the demand for safe-haven gold.
- Forex trading market participants may buy above the $1,786 level to target the $1,801 and $1,809 levels.
Gold prices closed at $1788.05 after reaching a high of $1797.35 and a low of $1782.25. After rising for five consecutive sessions, gold prices remained flat on Tuesday amid mixed market sentiments. Gold price forecast remains bullish on Wednesday, especially above the 1,785 pivot point level.
If you are interested in trading XAU/USD with forex robots, check out our guide.
The rising safe-haven appeal is due to increased uncertainty after the sudden collapse of the Afghan government. It kept supporting the safe-haven yellow metal prices, whereas the strength of the US dollar on Tuesday marked the precious metal under pressure. Hence, gold remained flat throughout the day.
Gold in a Bullish Mode Despite the stronger US dollar
The US dollar index rose on Tuesday and reached the 93.17 level, pushing the greenback higher that weighed on gold prices. Meanwhile, the US Treasury Yields on the benchmark 10-year note stopped their bearish trend. It turned green for the day as it advanced to 1.285% and added strength to the US dollar. That ultimately added further pressure on gold prices.
Quick Fundamental Review
At 01:00 GMT, the TIC Long-Term Purchases from June remained flat with the expectations of 110.9B. At 17:30 GMT, the Core Retail Sales from July dropped to-0.4% against the expected 0.2% and weighed on the US dollar.
The retail sales from July also declined and reached-1.1% against the predicted-0.2% and caused losses in the yellow metal. At 18:15 GMT, industrial production in July surged to 0.9% against the forecasted 0.5% and supported the US dollar. That added pressure on gold. The Capacity Utilization Rate also surged to 76.1% against the projected 75.7%, supporting the US dollar and underpinning gold.
At 19:00 GMT, the Business Inventories from June remained flat with projections of 0.8%. The NAHB Housing Market Index dropped to 75 in August from an expected 80 and helped gold sustain its position in the market.
On Tuesday, Federal Reserve Chairman Jerome Powell said that it was not clear whether the accelerated outbreak of the Delta variant of coronavirus would clearly impact the economy. Powell stated that people and businesses were adapting to the lifestyle with the coronavirus as it is likely to remain and continue affecting the economy.
Rapid Surge in Covid Cases Boosts Safe-haven demand.
According to the Centers for Disease Control and Prevention, the number of vaccine doses that have been administered as of yet has reached about 315 million. More than 72% of US adults receive only one dose, while 61.8% are fully vaccinated.
Powell said that the pace of vaccination was slow, although more people were getting vaccinated. He said that the US was ahead of many similar countries in vaccinating its population a few months ago. However, the government has fallen behind now. That has resulted in the outbreak of the Delta variant of the coronavirus in some parts of the country.
Powell did not mention anything about the Fed’s plan to taper asset purchases. Investors can get clues about this decision from the Fed in the upcoming release of the minutes of the July Fed meeting, which is scheduled for Wednesday.
Gold Price Forecast – Technical Levels
Support Resistance
1781.09 1796.19
1774.12 1804.32
1765.99 1811.29
Pivot Point: 1789.22
Gold Price Forecast – Daily Technical Analysis: Pivot Point $1789.22 Underpins
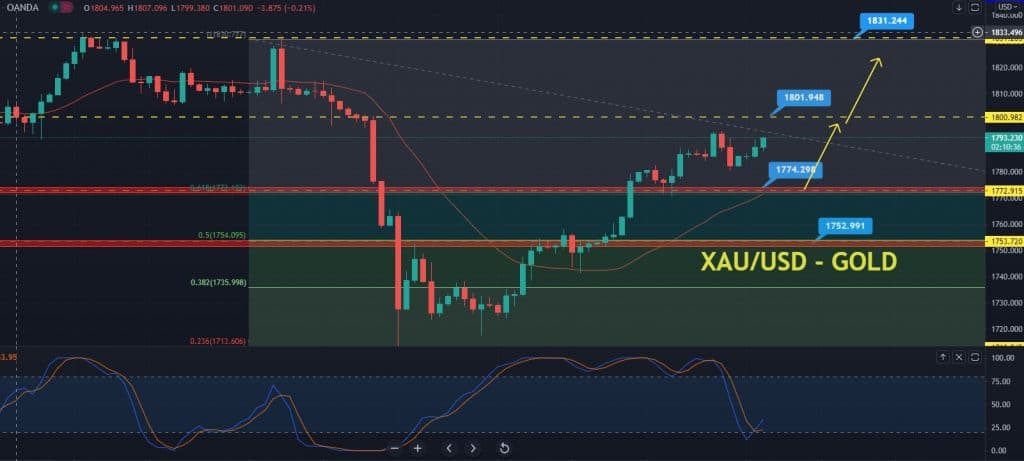
The gold price forecast remains bullish above the $1789 intraday pivot point support level. The metal continues to trade with a bullish bias as it is gaining significant support at a 61.8% Fibonacci retracement level of $1,772. Nevertheless, the $1,784 level is likely to extend support before it can reach $1,772.
The XAU/USD pair has formed a bullish engulfing candlestick. It’s expected to push the gold price higher on the 4-hourly chart. Gold’s next resistance is likely to be found around 1,801, and a breakout of this level could extend its prices further higher to 1,811 and 1,831.
The 50 day EMA (exponential moving average – red line) holds at 1,772 levels, indicating a bullish trend in gold. Besides, the leading indicator, Stochastic RSI, has entered the sell zone, holding at 21 levels.
The 50 day EMA (exponential moving average – red line) holds at 1,772 levels, indicating a bullish trend in gold. Besides, the leading indicator, Stochastic RSI, has entered the sell zone, holding at 21 levels.
Lastly, we can also see an upward trendline that supports the bullish trend in gold at the 1,786 level. Therefore, the Forex trading market participants may buy above the $1,786 level to target the $1,801 and $1,809 levels. Alternatively, selling trades can be seen on a bearish breakout below the 1,784 level today. All the best!
Looking to trade forex now? Invest at eToro!
67% of retail investor accounts lose money when trading CFDs with this provider. You should consider whether you can afford to take the high risk of losing your money.