- Afghan government’s collapse boosts the demand for safe-haven gold.
- Empire State Manufacturing Index from August dropped to 18.3 against the projected 28.9.
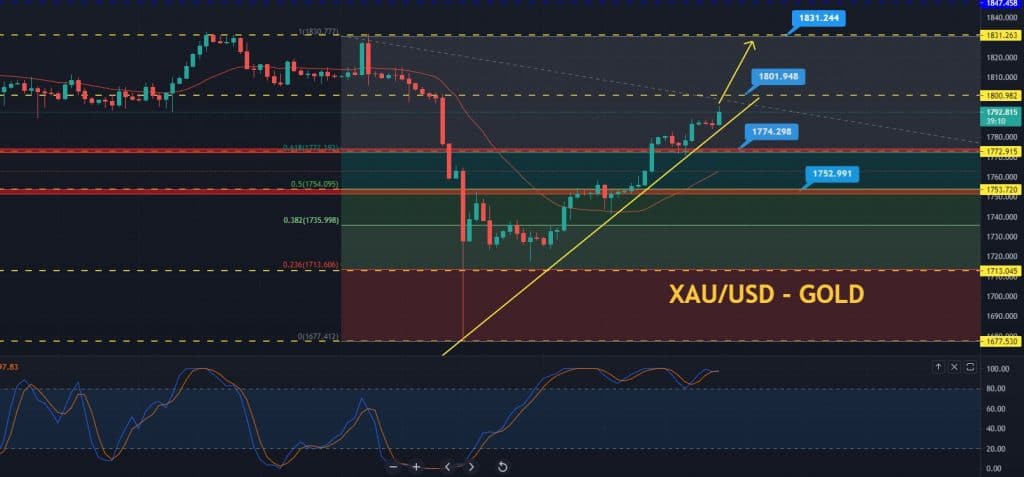
- Forex trading market participants may buy above the $1,786 level to target the $1,801 and $1,809 levels.
Gold prices closed at $1789.30 after reaching a high of $1791.30 and a low of $1772.15. The XAU/USD pair continued its bullish momentum for the 5th consecutive session and moved near the $1800 level amid the declining US Treasury Yields. Besides the easing concerns about early tapering by the Federal Reserve after a plunge in US consumer sentiment also plays a role. The gold price forecast remains bullish above the intraday pivot point support level of 1,784.25.
If you are interested in trading XAU/USD with forex robots, check out our guide.
The US Dollar Index, which measures the greenback’s value against the basket of six major currencies, moved a little upward towards the 92.66 level. Furthermore, the US Treasury Yields on 10-year notes continued their bearish momentum. These declined for a third consecutive session on Monday and reached 1.223, its lowest level since 5th August.
Weaker US Empire State Manufacturing Index Underpins Gold
There was not much data on the data front that was released from the US side on Monday. At 17:30 GMT, the Empire State Manufacturing Index from August dropped to 18.3 against the projected 28.9 and weighed on the US dollar, which added to gains in gold prices.
The US dollar came under pressure as expectations rose that the Fed might not aggressively taper its bond-buying program or alter the timeline for its first lift-off.
Furthermore, the rising number of coronavirus cases throughout the globe also added some weight to the greenback and helped the yellow metal gather strength due to its safe-haven status.
The precious metal held onto the support it gained after a mixed bag of economic data. Thus, the market believed the Fed might hold off on an early tapering and a possible interest rate hike despite an increasing number of policymakers have been discussing doing so.
On Friday, the data revealed that US consumer sentiment fell sharply this month to its lowest level in a decade, which eased concerns over an earlier than expected reduction in economic support from the central bank.
Fed’s July Meeting Minutes & US retail sales in Focus
Traders will be focusing on the release of the Fed’s July meeting minutes, which are scheduled to be released on Wednesday, along with the comments of Jerome Powell. Furthermore, monthly data on US retail sales on Tuesday will also give further hints on consumer sentiment, and investors will also be closely watching the data.
Afghan Government Collapse Boosts Safe-haven Demand
Another reason behind the rising prices of gold could be the political uncertainties that arose from the sudden collapse of the Afghan government. This pushed the need for safe-haven appeal and the yellow metal gained due to its safe-haven status on Monday. Political stability in the region came under question after the collapse of the Afghan government over the weekend, and hence, gold prices pushed higher on board as they tend to gain during uncertainty.
Gold Price Forecast – Technical Levels
Support Resistance
1777.20 1796.35
1765.10 1803.40
1758.05 1815.50
Pivot Point: 1784.25
Gold Price Forecast – Daily Technical Analysis: Pivot Point $1,784 Underpins
The XAU/USD price forecast remains bullish above the $1,784 intraday pivot point support level. Presently, the yellow metal gold is trading with a slightly bullish bias. It’s gaining significant support at a 61.8% Fibonacci retracement level of $1,772. However, on the way, the $1,784 level will also be supporting gold prices.
The XAU/USD pair has formed a bullish engulfing candlestick. It’s expected to push the gold price higher on the 4-hourly chart. Gold’s next resistance is likely to be found around 1,801, and a breakout of this level can extend its prices further higher until 1,811 and 1,831.
The 50 day EMA (exponential moving average – red line) has been left far behind at 1,760 levels. However, it’s indicating a bullish trend in gold. Likewise, the leading indicator, Stochastic RSI, has entered the overbought zone, holding at 97 levels.
Lastly, we can also see an upward trendline that’s supporting the bullish trend in gold at the 1,786 level. Therefore, the Forex trading market participants may buy above the $1,786 level to target the $1,801 and $1,809 levels. Alternatively, sell trades can be seen on a bearish breakout below 1,784 level today. All the best!
Looking to trade forex now? Invest at eToro!
67% of retail investor accounts lose money when trading CFDs with this provider. You should consider whether you can afford to take the high risk of losing your money.