- European Stocks Eased Amid Regulatory Concerns – Safe Haven Underpins Gold
- Trader’s focus shifts to the U.S. central bank’s meeting that’s due on Tuesday and Wednesday.
- Gold bullish mode persists above 1,800 levels today with a target of 1,810 and 1,817.
On Monday, the yellow metal gold traded bullish amid a weaker dollar, and a bearish trend in global equities increased demand for the safe-haven metal. Gold price forecast remains neutral as the metal is tossing into bullish and bearish zones.
In the meantime, traders are waiting for the U.S. Federal Reserve policy meeting for additional clues. The yellow metal gold surged around 0.4% to trade at $1,805.44; during the European session, the prices slipped to trade at the $1,801 level.
European Stocks Eased Amid Regulatory Concerns – Safe Haven Underpins Gold
Gold prices are supported amid risk-off market sentiment, as stock markets are taking a bearish turn along with a weakness in the U.S. dollar.
European stocks edged from all-time highs following regulatory concerns that knocked Asian stock markets lower. The U.S. dollar plunged 0.2% versus a basket of currencies. Along with the 10-year Treasury yields, that pulled back, diminishing the opportunity cost of holding non-interest-bearing asset gold.
COVID 19 cases proceeded to surge during the weekend, with some nations reporting record additions daily. For now, the trader’s focus shifts to the U.S. central bank’s meeting that’s due on Tuesday and Wednesday. They expect to have more clarity on monetary policy.
Gold Price Forecast – Technical Levels: Double Top Resistance at $1,810
Support Resistance
1800.65 1801.29
1800.34 1801.62
1800.01 1801.93
Pivot Point: 1808.98
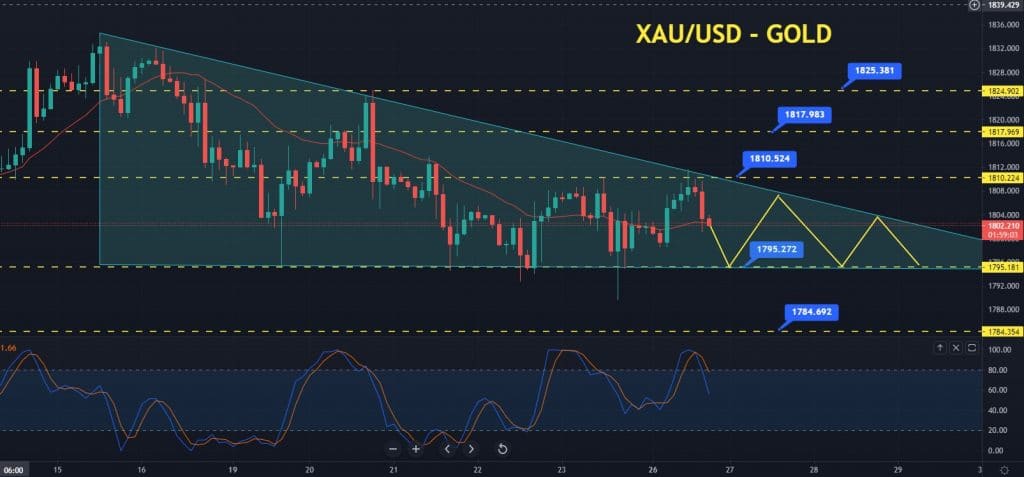
Gold Price Forecast – Technical Analysis: Triangle Pattern Supports at 1,795
- The gold price forecast remains mixed as the metal hasn’t been able to break above the $1,810 level. On the 2-hourly chart above, the double top pattern is extending resistance at 1,810 levels. The closing of the tweezers’ top pattern below this is suggesting weakness in the bullish trend.
- Gold has also closed a bearish engulfing followed by a tweezer top pattern below $1,810; that’s another reason to stay bearish on gold.
- The 50 periods EMA (Exponential Moving Average – Red Line) is trying to support gold price at 1,800 level.
- The oscillator indicator Stochastic is holding in a buying zone at 76, demonstrating a bullish trend in gold. However, we can also see it has reversed after entering the overbought zone. So until and unless it’s crossing below 50, the bulls are still in the game.
- On the 2-hourly chart, gold has closed a descending triangle pattern that’s supporting it at 1,795. Typically such patterns trigger a breakout on the lower side, so bulls need to be very careful once 1,795 is violated. This can open a gold bearish trend until 1,784 or even lower.
- Forex trading market participants will want to stay in a bullish mode above 1,800 levels today, targeting 1,810 and 1,817. Alternatively, closing below 1,800 can lead the gold price towards 1,795 and 1,784 levels. All the best!
Looking to trade forex now? Invest at eToro!
67% of retail investor accounts lose money when trading CFDs with this provider. You should consider whether you can afford to take the high risk of losing your money.