- Gold gains as the US CPI data figures were released.
- Overall, US Dollar lost traction as the inflation slightly decreased for July.
- Fed tapering and the safe-haven status of gold are the key points for investors.
Gold price continued to trend higher on Wednesday after fluctuating in a directionless fashion the day before. It also recovered from a near-weekend low earlier in the week. There is concern about the potential economic impact of the rapidly spreading delta variant of the Coronavirus, which has helped the precious metal become a safe haven to some extent. In response to mixed US consumer inflation, XAU climbed to two-day highs near $ 1,750 early in the North American session.
–Are you interested to learn more about crypto signals? Check our detailed guide-
Accordingly, the general CPI for July declined to 0.5% from 0.9% the previous month. The annual rate remained at 5.4% during the month under review, while the consensus forecast indicated a slight decline to 5.3%.
Against that backdrop, the core consumer price index, excluding food and energy prices, increased 0.3% MoM. In addition, the US dollar-denominated dollar exchange rate was seen to rise further due to some profit-taking in US dollars.
Nevertheless, investors are convinced that the Fed will soon begin to backtrack on the incentives taken during the pandemic era. Moreover, US Treasury yields continued to rise, exacerbating the problem.
Consequently, those gains could deter traders from making aggressive bullish bets on ruthless metal given modest gains on US stock futures. Instead, we recommend waiting for some strong follow-up purchases before setting our expectations for further gold appreciation.
The current upward trend in gold has been dampened by expectations that the Fed’s massive stimulus will soon expire.
Thus, investors have been pushed closer to the probable time for a monetary tightening. Also, Fed officials are leading the market towards a quick end to the massive stimulus of the post-pandemic era and an increase in interest rates from 2022.
–Are you interested to learn more about forex bonuses? Check our detailed guide-
Gold price technical outlook: 20-period SMA to cap gains
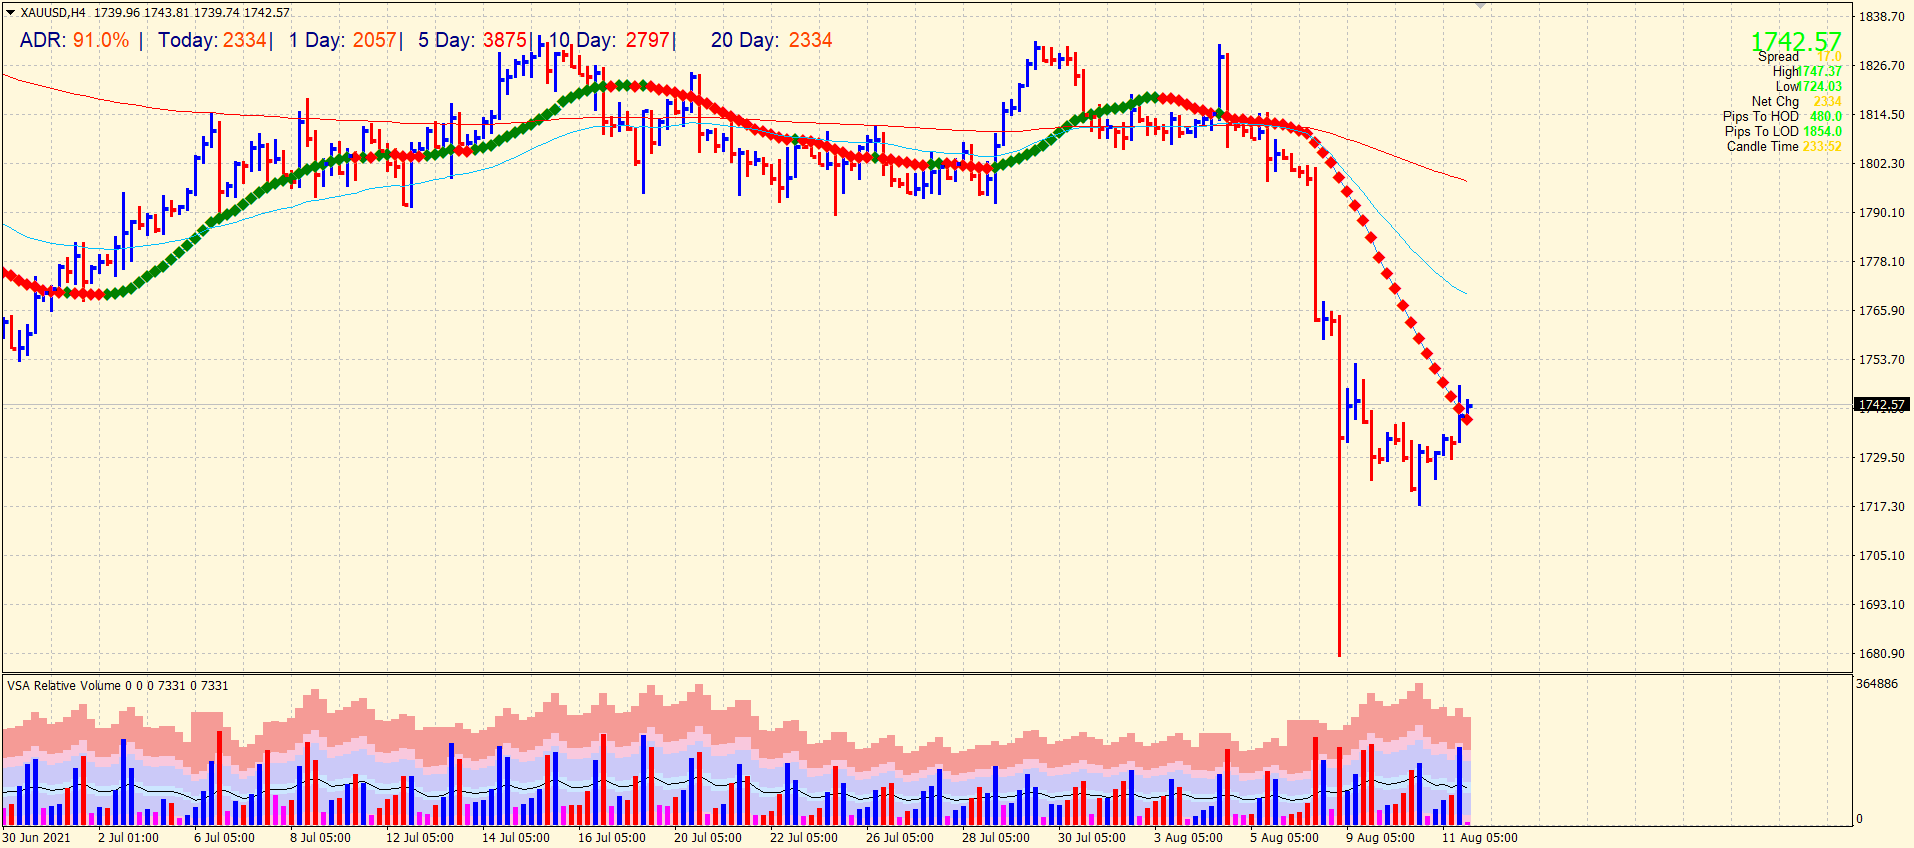
The recent upside remains largely capped by the 20-period SMA on the 4-hour chart. The metal has already completed the 91% average daily range. It is likely for the gold to consolidate the gains before further moving up. If the gold dominates the 20-period SMA, the price can rally towards $1780, followed by $1800.
Looking to trade forex now? Invest at eToro!
67% of retail investor accounts lose money when trading CFDs with this provider. You should consider whether you can afford to take the high risk of losing your money.
