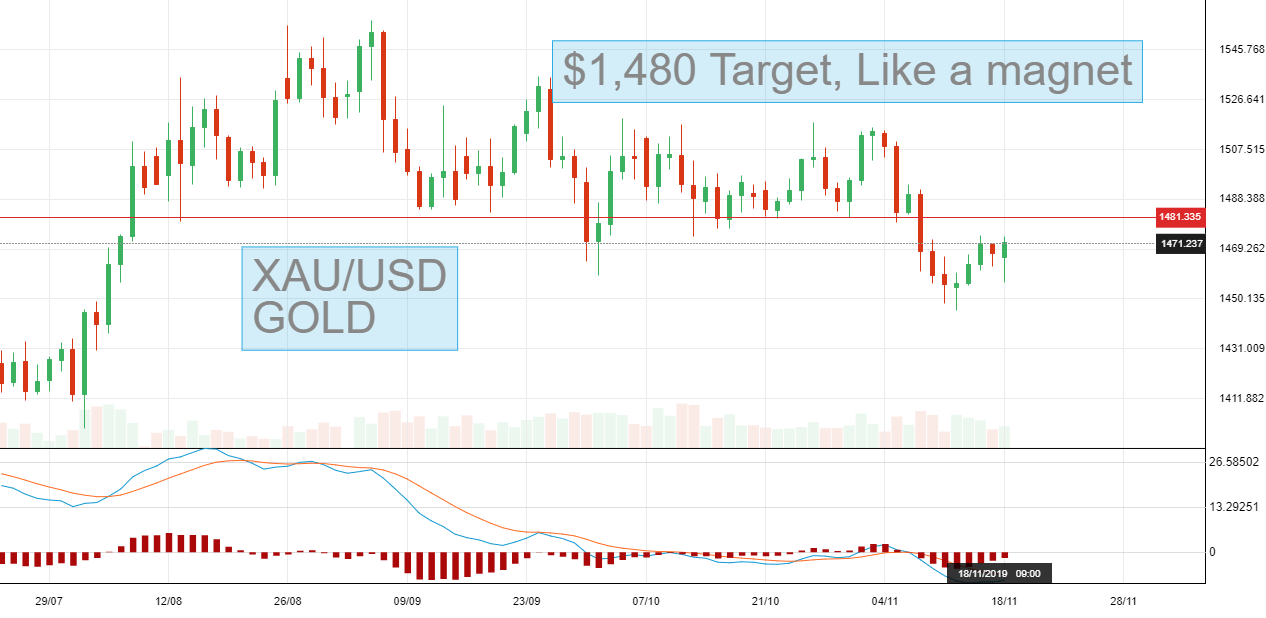
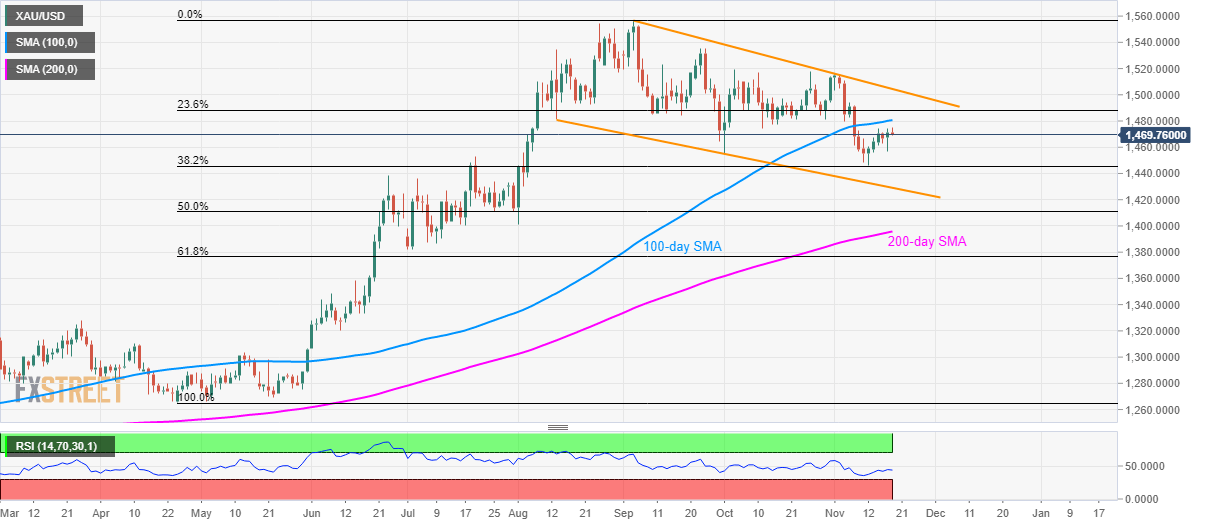
Gold Technical Analysis: 100-day SMA, 11-week-old trendline, cap immediate recovery
Prices are likely to revisit the 38.2% Fibonacci retracement of April-September upside movement, at $1,445. However, a downward sloping trend-line since August 13, at $1,429, followed by a 50% Fibonacci retracement level of $1,410 limits the bullion’s further declines. Read more”¦
Gold consolidates the New York rally in $1,470s, bulls look to a 61.8% Fibo target
Spot gold is currently trading between a range of $1471.56 and $1475.43, buoyed by a slightly risk-off session overnight following Sino/US trade deal headlines and pessimism as well as a weakening in the greenback and US yields. Read more…
Gold: Supported by the risk tone
The mind boggles, but I would say $1,557 (high for this year) will be challenged. Let’s not make assumptions or get too far down the road before we check the rearview mirror because the Brexit & HK issues are still clouding things at the same time as we seem so far yet so near a trade deal (finally) being inked between the US & China. Read more…