- 50-day SMA and 38.2% Fibo guards immediate upside.
- Buyers lurk around $1266/65 horizontal area.
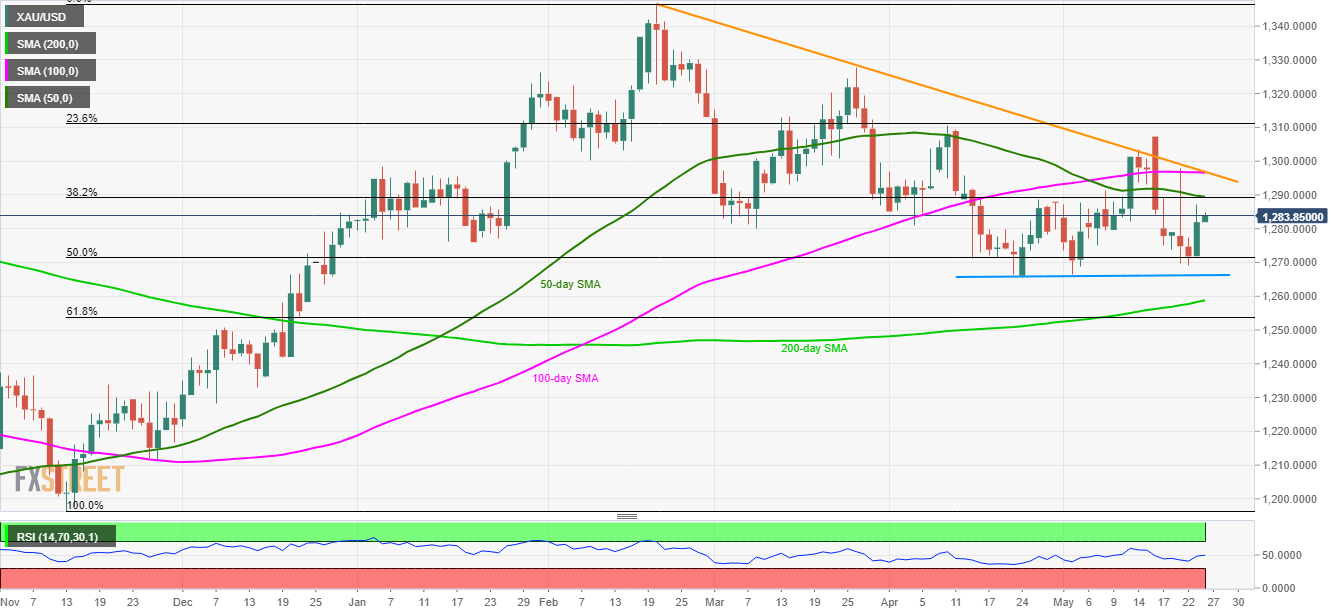
Gold prices extend the previous U-turn from 50% Fibonacci retracement to $1283.85 ahead of the Europe market opens on Friday.
The bullion’s immediate upside can be questioned by 50-day simple moving average (SMA) and 38.2% Fibonacci retracement of November 2018 to February 2019 upside, around $1290.
During the precious metal’s increased upside beyond $1290, 100-day SMA and a descending trend-line from February top could challenge buyers near $1297, a break of which can recall $1307 on the chart.
On the contrary, a sustained decline under 50% Fibonacci retracement of $1271 can entertain sellers with $1266/65 ahead of pushing them towards $1258 that nears 200-day SMA.
Also, 61.8% Fibonacci retracement of $1253.80 holds the gate for the quote’s south-run to $1242.
Gold: daily chart
Trend: Sideways
