Gold trades near $1274 during early Thursday. The yellow metal dropped beneath 38.2% Fibonacci retracement of its August 2018 to February 2019 upside for the first time since in 2019 on yesterday.
As a result, chances of its further weakness towards an upward sloping trend-line since August 2018, at $1262, can’t be denied. Though, $1270 and $1266/65 can act as intermediate halts during the decline.
In a case where the quote slips under $1262 support-line, 200-day simple moving average (SMA) near $1250 could become sellers’ favorite.
On the upside break of $1276 figure comprising 38.2% Fibonacci retracement, $1281 and 100-day SMA level of $1289 could please buyers.
Should there be increased buying past-$1289, $1296, $1301 and 50-day SMA level of $1304 can please buyers ahead of challenging $1309 trend-line resistance stretched since February.
Gold daily chart
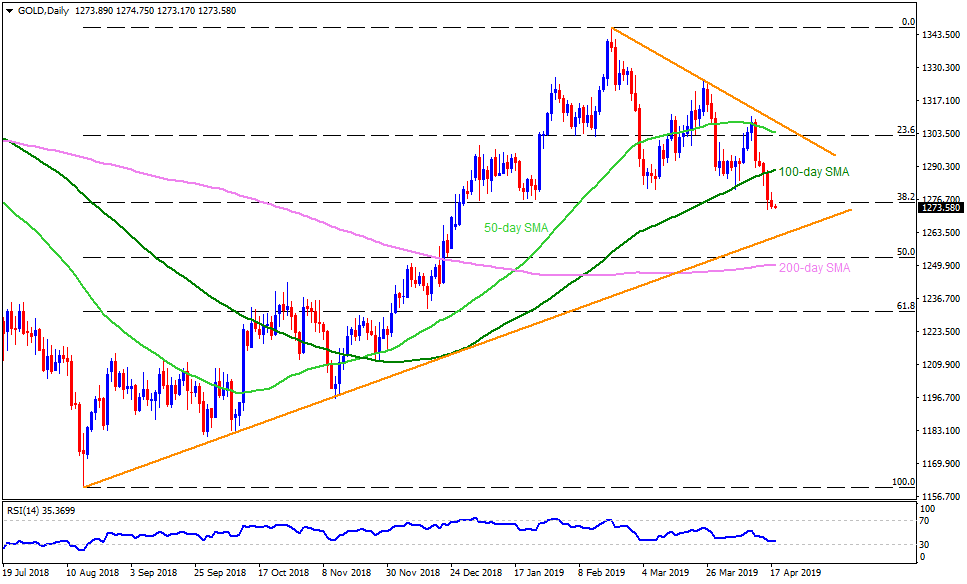
Trend: Bearish
