“¢ The commodity has been oscillating within a broader trading range since the beginning of this week, forming a rectangular chart pattern on the 1-hourly chart.
“¢ The commodity is testing 200-hour SMA for the first time since July 31 now seems to have raised prospects for a bullish breakout.
“¢ Technical indicators on the mentioned chart are holding with a mild positive bias and further add credence to the near-term bullish outlook.
Gold 1-hourly chart
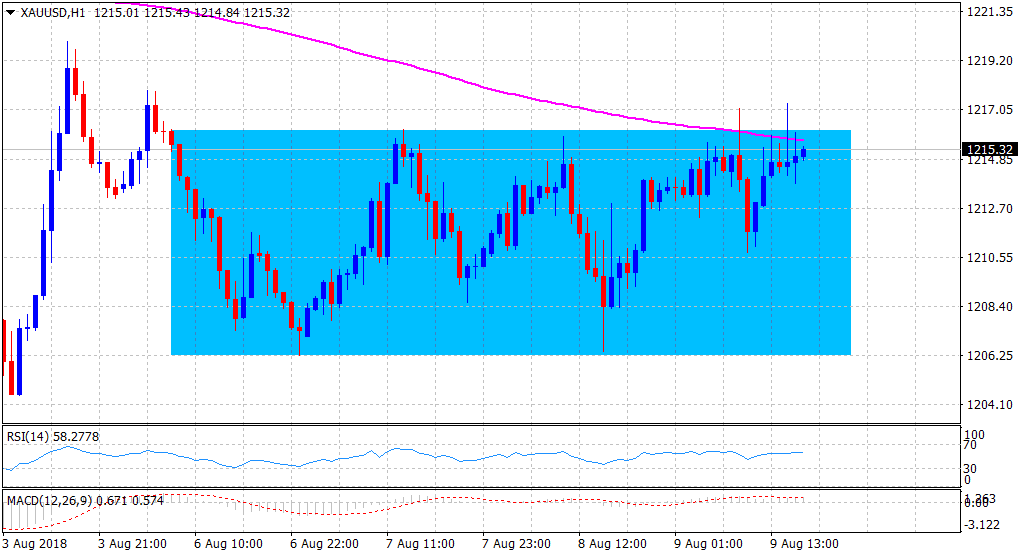
Spot Rate: $1215.32
Daily High: $1217.31
Daily Low: $1210.79
Trend: Near-term bullish break-out awaited
Resistance
R1: $1218 (weekly high set on Monday)
R2: $1222 (horizontal zone)
R3: $1228 (July 31 swing high)
Support
S1: $1211 (current day swing low)
S2: $1205 (17-month low set last Friday)
S3: $1200 (psychological round figure mark)
