- Gold regains its stand above $1,500 after successfully bouncing off 10-day EMA.
- Friday’s high becomes the key for now.
Following its successful bounce off 10-day exponential moving average (EMA), Gold takes the bids to $1507 during the early Asian session on Wednesday.
The yellow metal now heads to Friday’s high around $1528 ahead of questioning the monthly top surrounding $1535.
It should, however, be noted that 14-bar relative strength index (RSI) and 12-bar moving average convergence and divergence (MACD) are less favorable to the bullion’s further upside.
If at all bulls ignore technical indicators, $1,550/55 area can offer an intermediate halt to further north-run towards April 2013 high near $1,600.
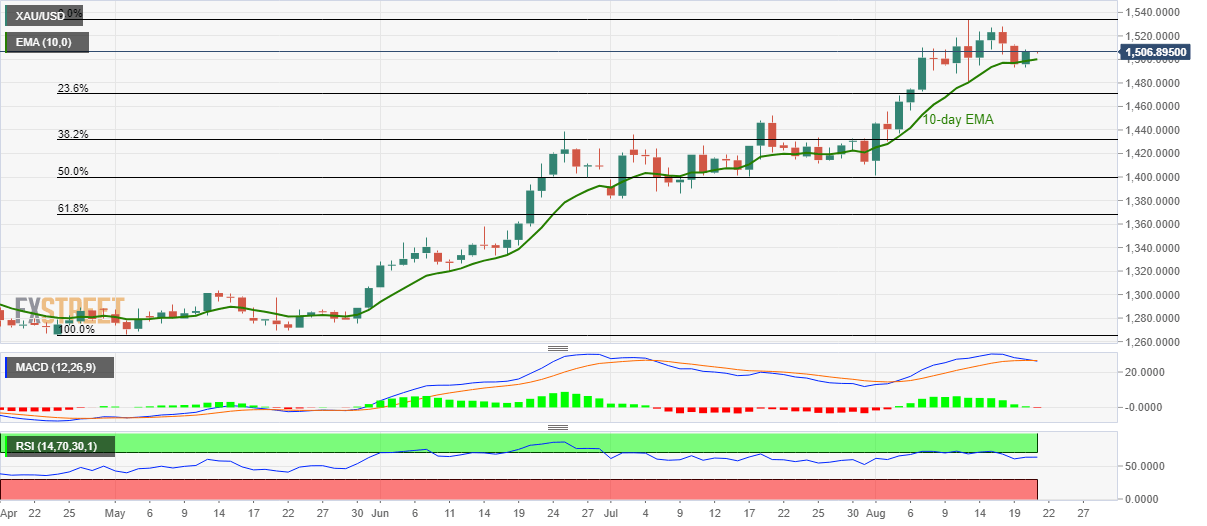
Alternatively, a downside break below10-day EMA level of $1,500 will drag the quote to 23.6% Fibonacci retracement of April-August upside, at $1,471.
Gold daily chart
Trend: Bullish
