“¢ The precious metal continued with its range-bound price action through the mid-European session, albeit has managed to hold its neck above 100-period SMA.
“¢ With technical indicators on the 1-hourly chart holding comfortably in positive territory, a follow-through up-move beyond 200-period SMA now seems to pave the way for an additional near-term recovery move.
“¢ However, easing USD bearish pressure could turn out to be the only factor capping any meaningful up-move for the dollar-denominated commodity.
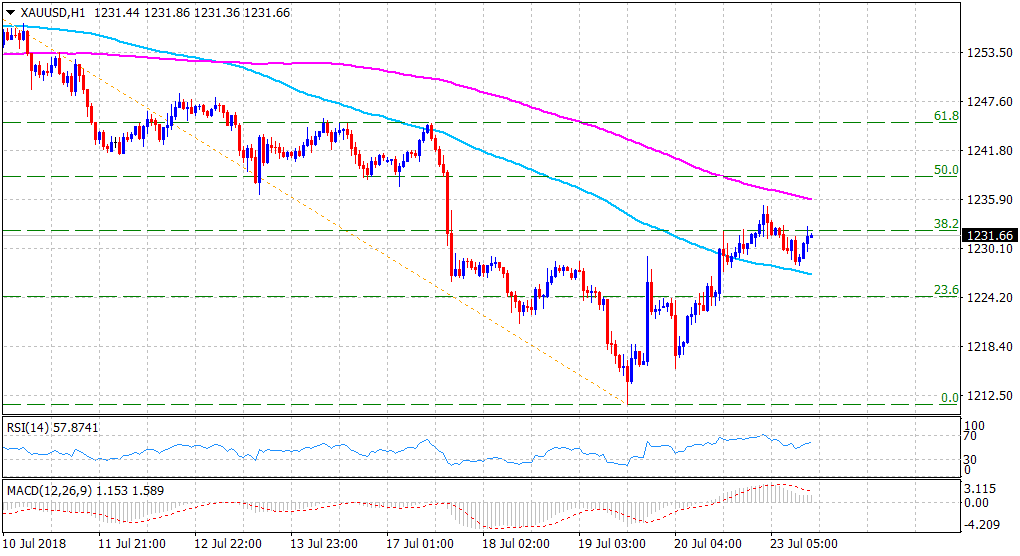
Spot rate: $1231.66
Daily High: $1235.16
Daily Low: $1228.07
Trend: Slightly bullish
Resistance
R1: $1236 (200-period SMA H1)
R2: $1241 (horizontal zone)
R3: $1245 (20-day SMA)
Support
S1: $1227 (100-period SMA H1)
S2: $1223 (horizontal zone)
S3: $1216 (Friday’s swing low)
