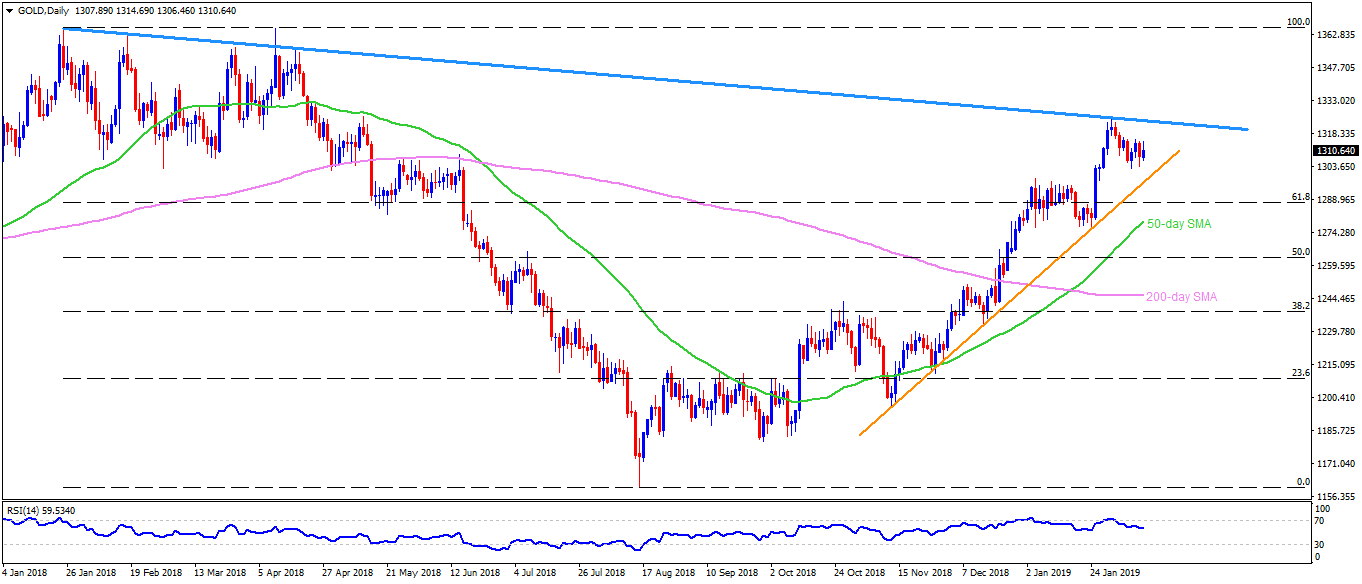
Gold daily chart
- Gold prices trade around $1310 by the end of Tuesday’s trading.
- The yellow metal maintains its early-month pullback from a downward sloping trend-line connecting 2018 highs with 14-day relative strength index (RSI) decelerating since the start of February.
- As a result, an ascending trend-line stretched from late November, at $1296, is likely gaining sellers’ attention.
- In case the quote drops under $1296 on a daily closing basis, the 61.8% Fibonacci retracement of its 2018 downturn near $1287.30 and the 50-day simple moving average at $1279 could become Bears’ favorites.
- Meanwhile $1316 and the aforementioned trend-line at $1325 can keep limiting the bullion’s near term upside.
- Should there be additional upside past $1325, $1333 and $1341 may appear on the chart.
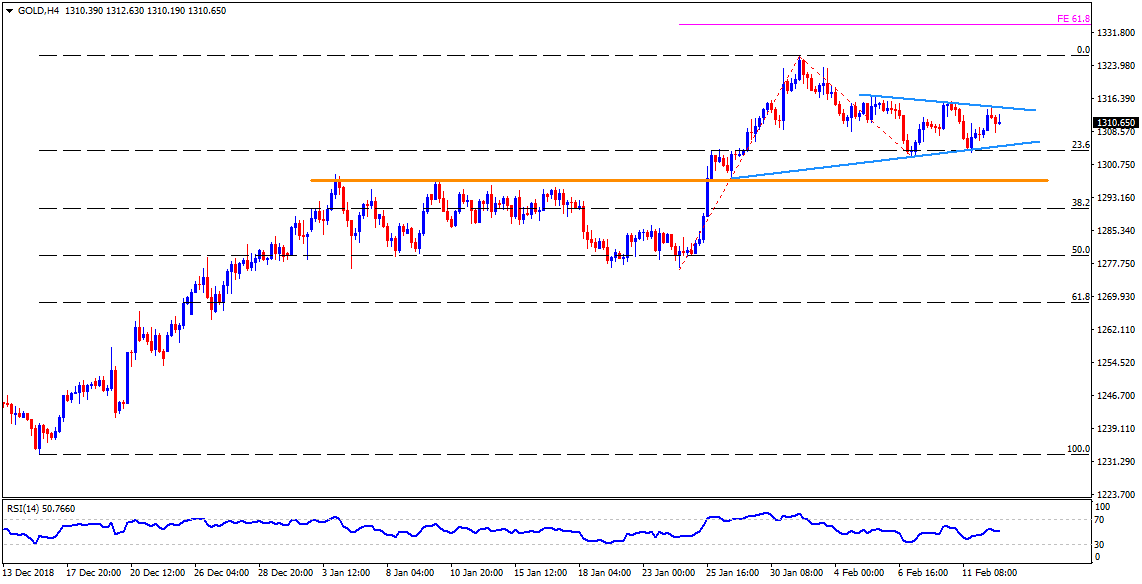
Gold 4-Hour chart
- Short-term symmetrical triangle confines Gold moves between $1305 and $1314.30 on H4 chart.
- Latest U-turn from the pattern resistance shifts market attention to the $1305 support-line, a break of which can drag the quote to $1300 and then to a horizontal-area connecting early-January highs near $1297.
- On the upside clearance of $1305 could trigger the recovery to $1317 whereas $1323 and January high near $1326 might please buyers afterward.
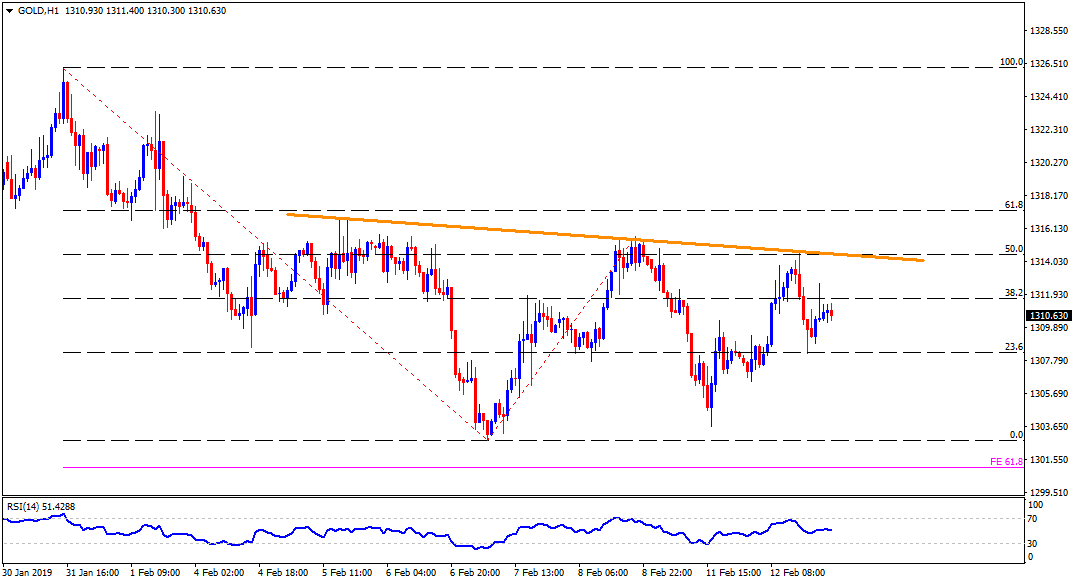
Gold hourly chart
- The XAU/USD’s refrain to rise past immediate trend-line resistance, at $1314.50, shows its weakness that can fetch it to $1309 and $1305 re-test while $1302.70 and 61.8% Fibonacci Expansion of its February month moves, at $1301, can play its role of supports then after.
- Alternatively, $1312.80 seem nearby resistance ahead of aiming the $1314.50 but a successful break of $1314.50 might not hesitate to recall $1317 as a quote.