- Gold trades around the lowest since last Monday.
- Bearish MACD, sustained trading below key EMAs keep sellers hopeful.
- An upside break of 21-day EMA will trigger short-term recovery.
Gold prices slip beneath 100-day EMA while taking rounds to $1,461 during the initial trading session on Monday.
The yellow metal’s trading below 100-day and 21-day Exponential Moving Averages (EMAs) takes clues from 12-bar Moving Average Convergence and Divergence (MACD) that has been sending bearish signals recently.
As a result, 61.8% Fibonacci retracement of July-September upside, at 1,448.50, gains sellers’ attention, a break of which will shift bears’ focus to 200-day EMA level of $1,417.
Meanwhile, an upside clearance of a 100-day EMA level of $1,464 could push the bullion towards $1,475 including 21-day EMA.
Assuming that the buyers’ sneak in around $1,475, a fresh upside to $1,481 and 38.2% Fibonacci retracement around $1,490 can be expected.
Gold daily chart
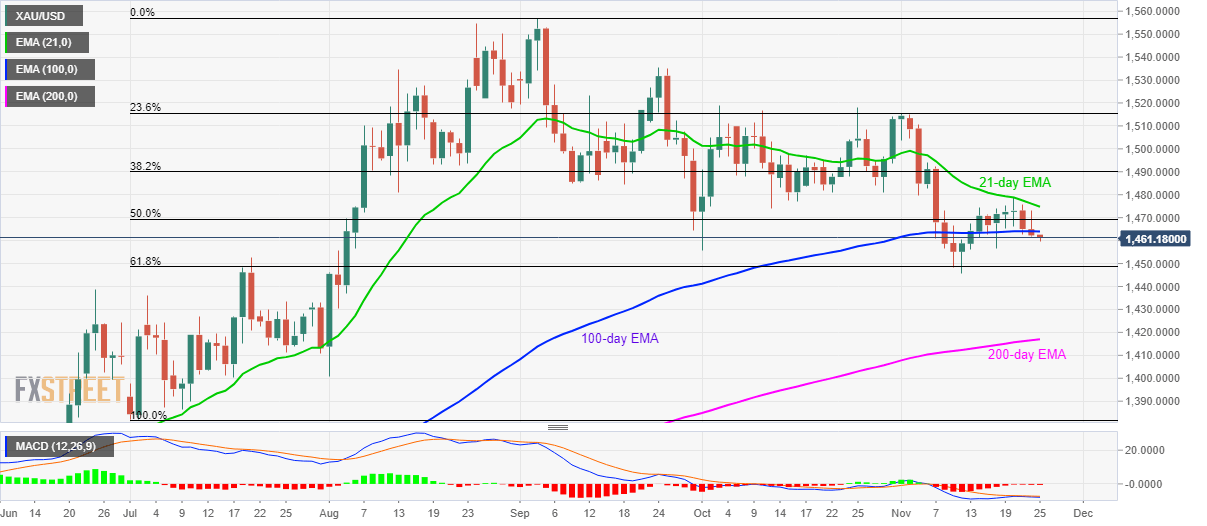
Trend: Bearish
