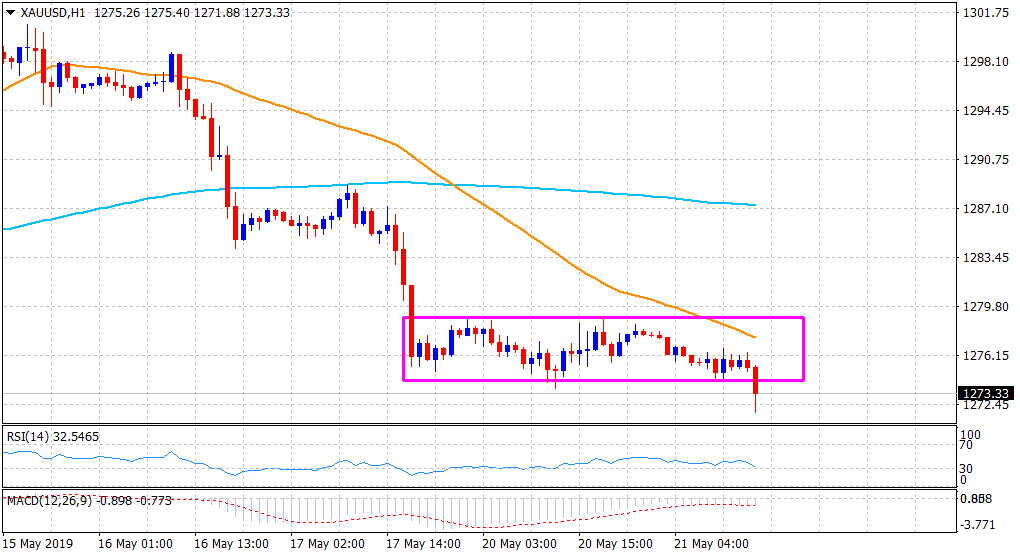
“¢ Gold finally broke down of its consolidative trading range – forming a bearish continuation rectangle chart pattern and tumbled to fresh two-week lows.
“¢ A sustained break through the pattern support near the $1274 horizontal zone was seen as a key trigger behind the latest leg of a sudden drop in the last hour.
The occurrence of death-cross on hourly charts – wherein 50-period SMA crosses below 200-period SMA, add credence to the bearish set-up. However, technical indicators on the 4-hourly chart remained in the oversold territory and might turn out to be the only factors holding traders from placing aggressive bearish bets.
Meanwhile, oscillators on the daily chart maintained their bearish bias and are still far from being in the oversold zone, clearly suggesting that any attempted bounce might still be seen as a selling opportunity near the $1278-79 region for an eventual slide back towards monthly swing lows support near the $1266 region.
Gold 1-hourly chart