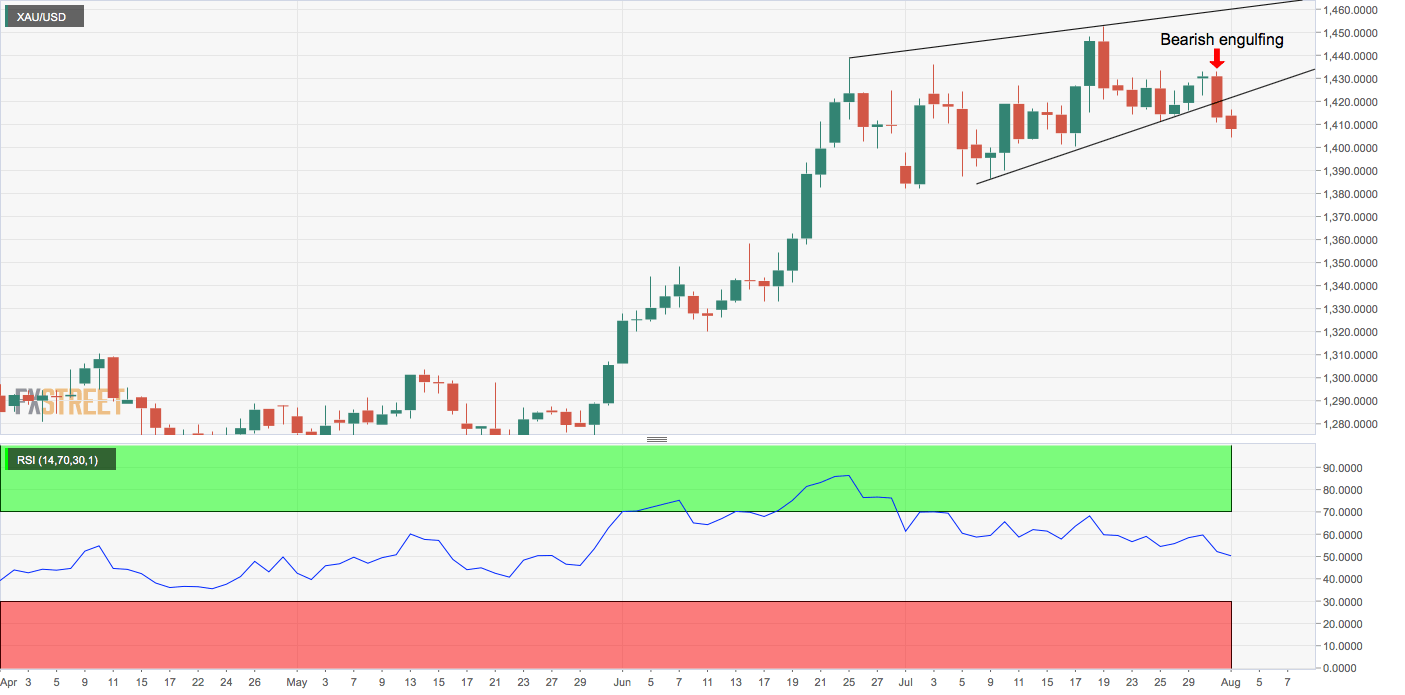
- Gold’s daily chart shows a bearish engulfing candle.
- The 14-day RSI has turned bearish for the first time since the last week of May.
Gold is looking south and could drop below $1,400 before the weekend, according to technical charts.
The yellow metal fell from $1,434 to $1,410 on Wednesday, engulfing the price action seen in the preceding seven days.
The bearish engulfing candle indicates a resumption of the pullback from the July 19 high of $1,453.
Further, the metal also confirmed a downside break of an ascending channel with a close below $1,420 yesterday.
What’s more, the 14-day relative strength index is now reporting bearish conditions with a below-50 reading for the first time since the end of May.
All-in-all, the path of least resistance is to the downside. Acceptance below the psychological support of $1,400 would shift risk in favor of a drop to the ascending 50-day moving average (MA), currently located at $1,378.
As of writing, gold is changing hands at $1,407, representing 0.30% drop on the day.
Daily chart
Trend: Bearish
Pivot levels
