Gold is fast closing on a year-to-date high of $1,326 reached on Jan. 31 and may break higher toward $1,354 (100-month moving average) if trade optimism continues to hurt the US dollar.
The 14-week relative strength index (RSI), however, has jumped to 71.06 – the highest level since 2011. That is also the first above-70 (overbought) reading since July 2016.
An overbought RSI indicates a minor pullback could be in the offing before a convincing break above the year-to-date high of $1,326 unfolds.
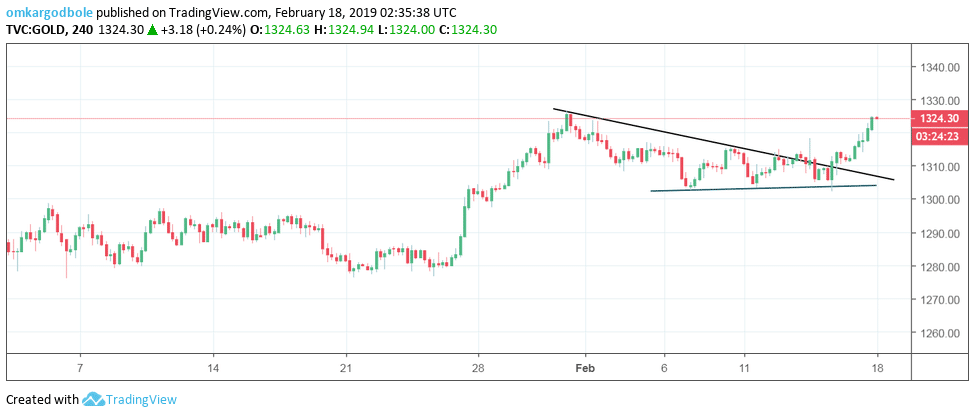
4-hour chart
Weekly chart
-636860542991246691.png)
Trend: bullish
