- Gold witnessed a bull flag breakout (bullish continuation pattern) on Monday.
- The metal’s rebound from the confluence of ascending 50-hour moving average (MA) and the upper end of bull flag (now a support) my recharge engines for a break above $1,266 (Monday’s high).
- Further, the 50-hour MA is holding above the 100-hour MA, and the 100-hour MA is located above the 200-hour MA, indicating the path of least resistance is to the higher side.
Hourly chart
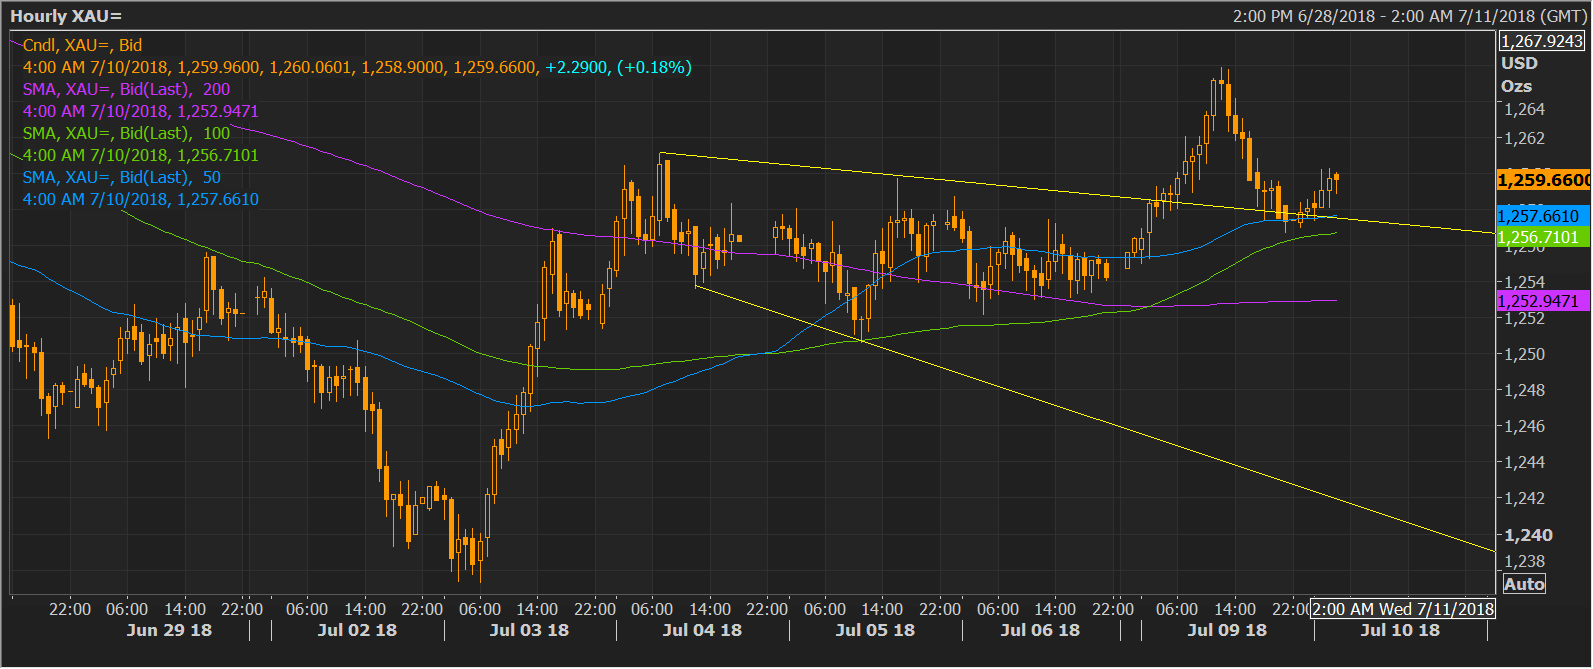
Spot Rate: $1,259
Daily High: $1,260
Daily Low: $1,257
Trend: Bullish
R1: $1,261.14 (Jue 21 low)
R2: $1,272 (June 25 high)
R3: $1,282 (May 21 high + bull flag breakout target as per the measured height method)
Support
S1: $1,257 (5-day moving average)
S2: $1,251 (July 5 low)
S3: $1,238 (July 3 low)
