Gold daily chart
- Gold prices trade around $1312.30 near to the end of Thursday.
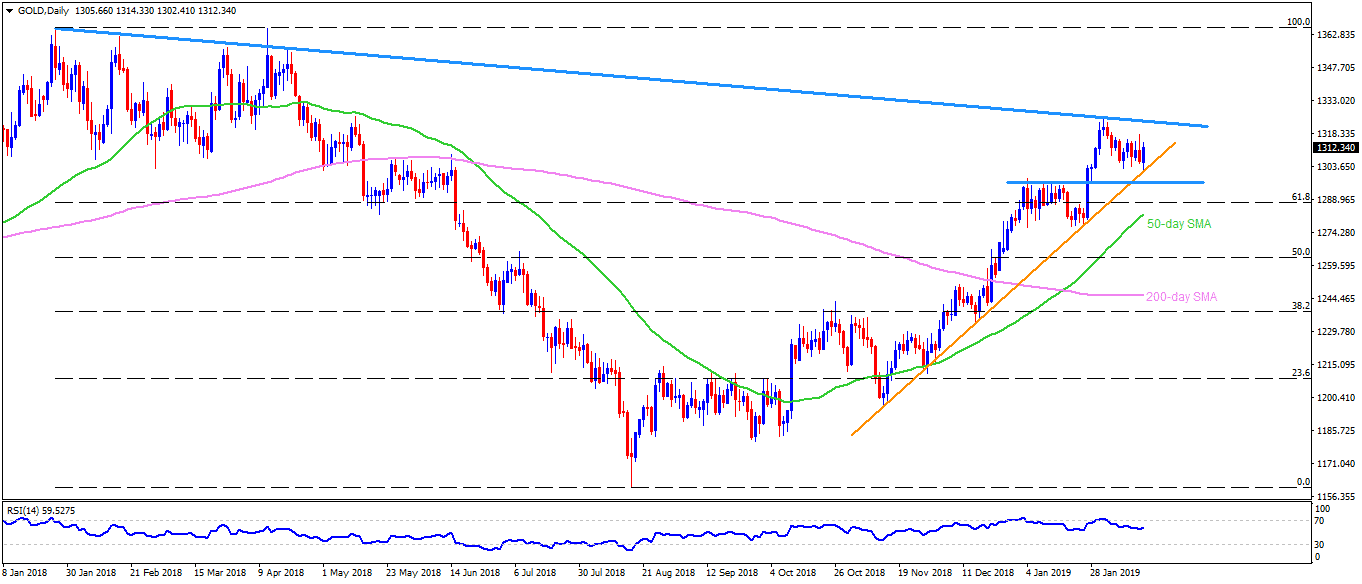
- The yellow metal did bounce from an upward sloping trend-line that connects lows since mid-November at $1302 now.
- With the quote’s recent recovery off the support-line, it’s up moves to previous day high around $1318.10 and then to the descending resistance-line, at $1325, that joins 2018 highs, become brighter.
- In case prices rally past-$1325 on a daily closing basis, $1328 and $1334 may appear on buyers’ radar.
- On a downside break of $1302 support-line, the metal can drop to horizontal-area near $1296.30-20 whereas its further decline highlights the importance of 50-day simple moving average (SMA) figure of $1282.20.
Gold 4-Hour chart
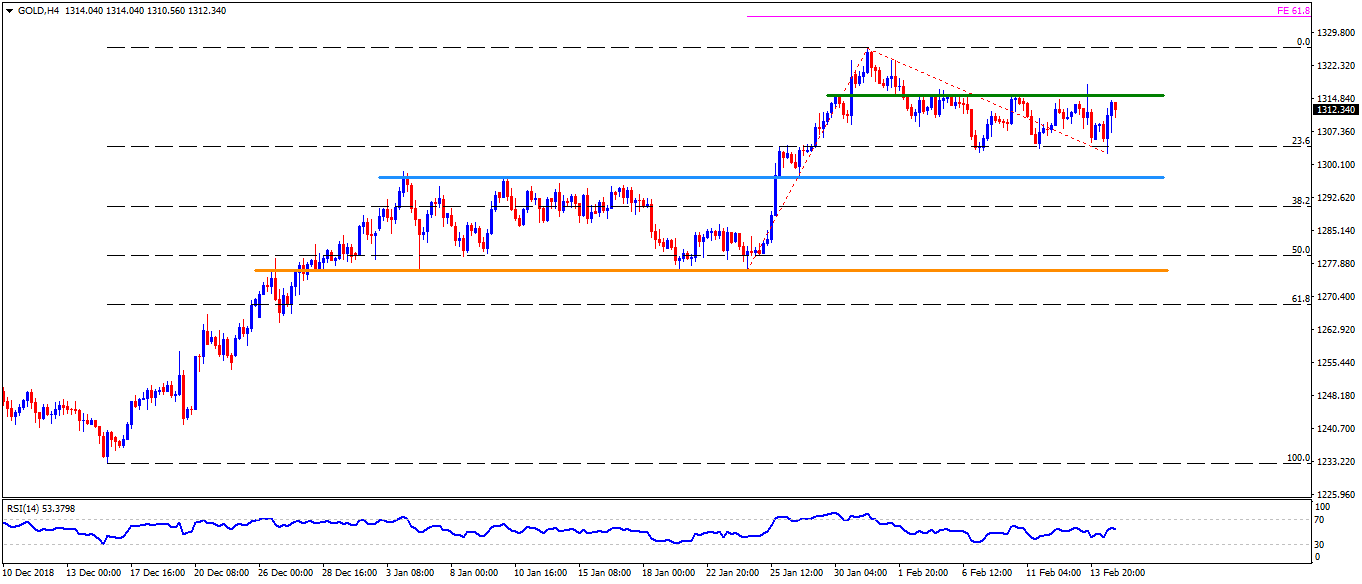
- On the H4 chart, $1315.60-65 horizontal-area can limit immediate advances prior to diverting market attention to $1318.10 and $1325.
- Here, recent high of $1326.20, followed by 61.8% Fibonacci expansion of last three-week move at $1333.20 may offer intermediate halts ahead of pushing bulls to $1334.
- Alternatively, 23.6% Fibonacci retracement of mid-December to January-end upside, at $1304, act as nearby support to watch during a pullback before $1296.30-20, $1286.70 and $1282.20 flashes sellers’ mind.
Gold hourly chart
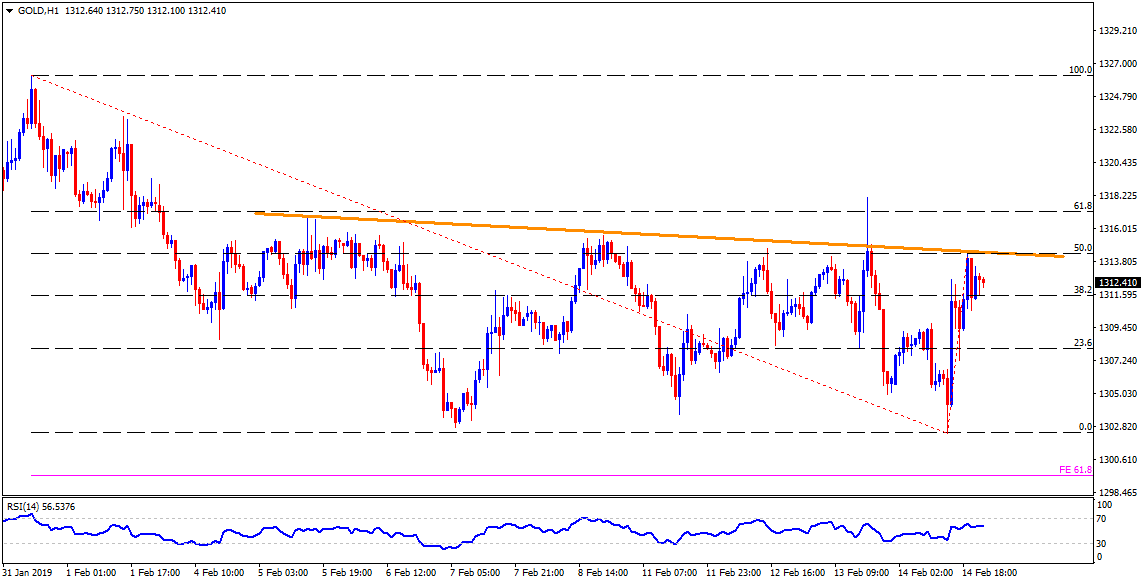
- The hourly chart shows 50% Fibonacci retracement of its recent move and a descending trend-line stretched since early last-week challenging the immediate rise around $1314.30.
- On the downside $1309.20 and $1304.80 seems immediate supports.


