“¢ Overnight hawkish comments by the Fed Chair Jerome Powell remain supportive of resurgent USD demand and kept exerting downward pressure on the dollar-denominated commodity.
“¢ Yesterday’s fall below 200-week SMA marked a fresh bearish breakdown, with bears now looking for a subsequent weakness through a downward sloping trend-channel on the daily chart.
“¢ Daily/hourly RSI (14) point to highly oversold conditions, albeit has failed to lend any support and stall the ongoing bearish momentum to the lowest level since July 2017.
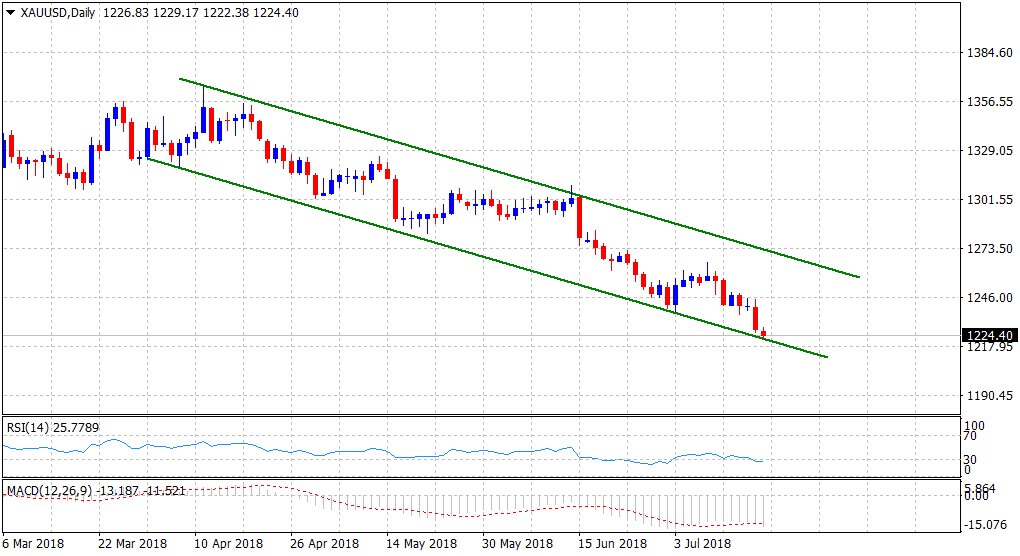
Spot rate: $1224.40
Daily Low: $1222.38
Daily High: $1229.17
Trend: Bearish
Resistance
R1: $1229 (current day swing high)
R2: $1234 (200-week SMA)
R3: $1238 (previous YTD swing low)
Support
S1: $1229 (July-14, 2017, daily closing low)
S2: $1220 (round figure)
S3: $1214 (horizontal zone)
