“¢ After Friday’s rejection slide from an important horizontal resistance, the precious metal traded with a mild negative bias at the start of a new trading week.
“¢ The fact that the commodity has held below key moving averages (100 & 200-period) confluence hurdle on the 4-hourly chart points to some additional intraday weakness.
“¢ Technical indicators on the mentioned chart have failed to recover from the negative territory and thus, add credence to the short-term negative outlook.
“¢ However, a sustained move beyond the key $1200 psychological mark might trigger a short-covering bounce back closer to an over two-week old barrier.
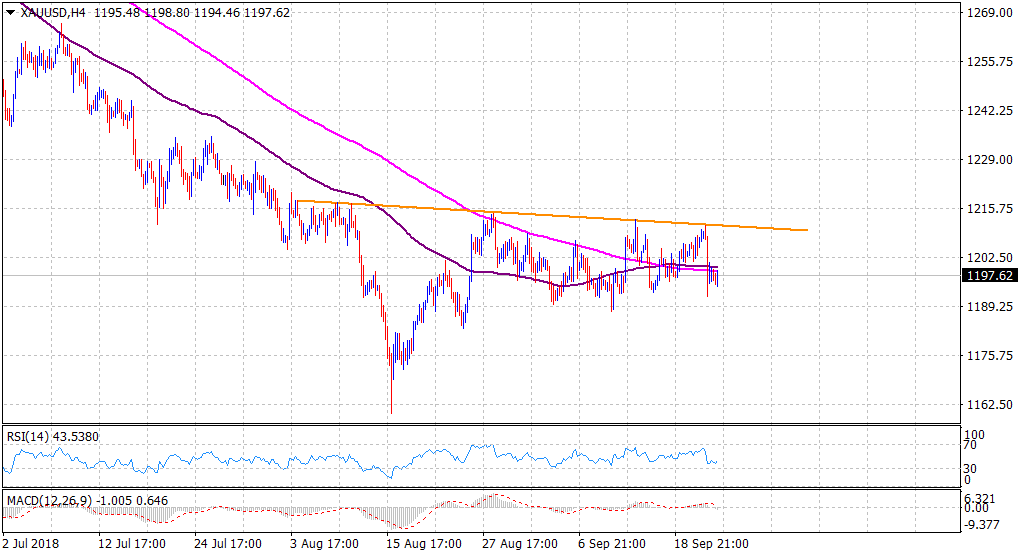
Spot Rate: $1197.62
Daily High: $1199.25
Daily Low: $1194.46
Trend: Intraday bearish
Resistance
R1: $1200 (psychological round figure mark)
R2: $1207 (horizontal zone)
R3: $1211 (Friday’s swing high)
Support
S1: $1192 (Friday’s swing low)
S2: $1188 (monthly low set on Sept. 11)
S3: $1183 (horizontal zone)
