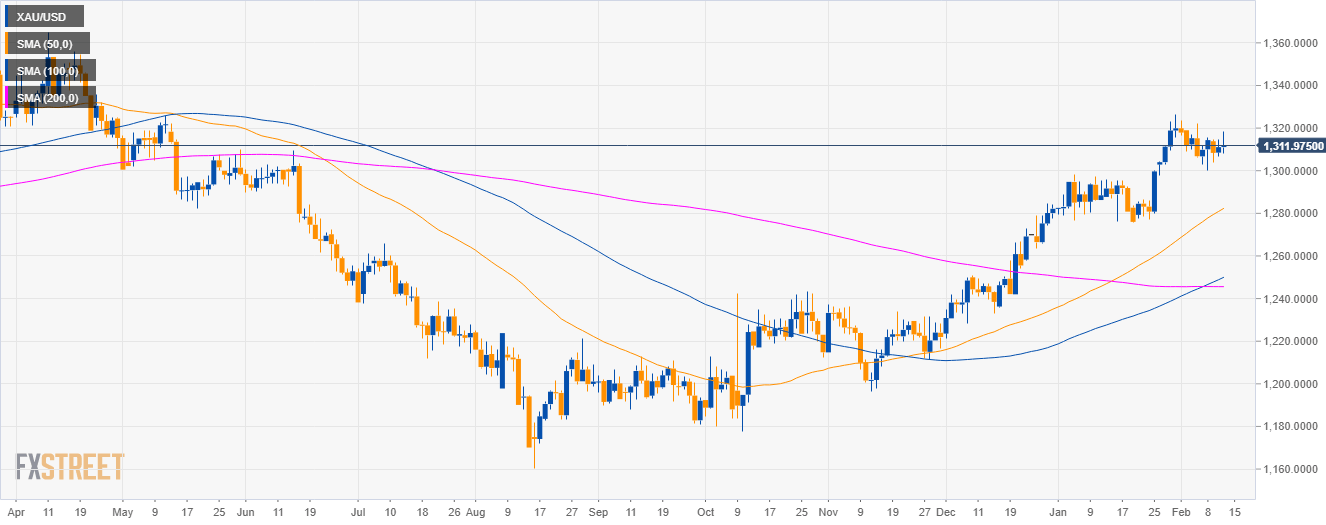
Gold daily chart
- Gold is in a bull trend above its main simple moving averages (SMAs).
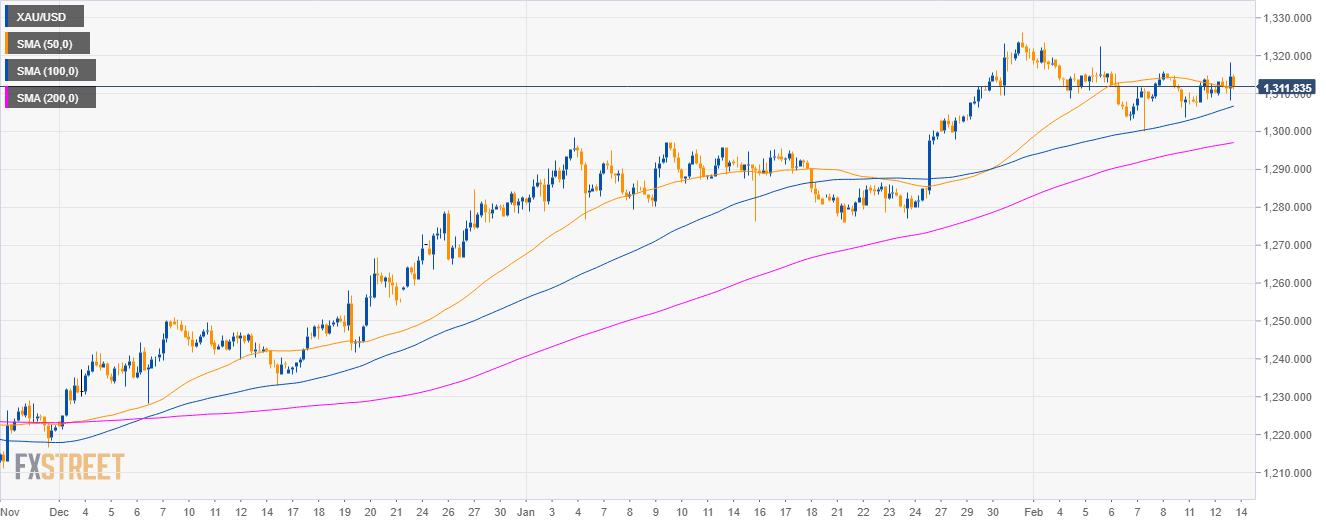
Gold 4-hour chart
- Gold is trading above its 100 and 200 SMA suggesting bullish momentum.
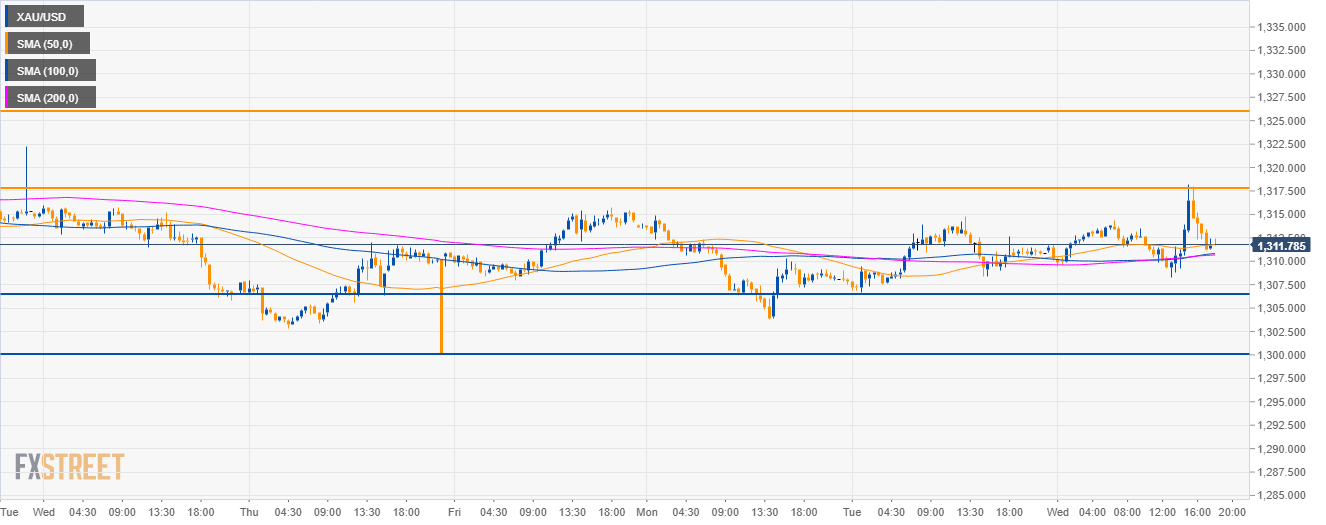
Gold 30-minute chart
- Gold is trading just above its main SMAs suggesting a mild bullish bias.
- The level to beat for bulls is 1,317.50 in order to reach 1,326.00.
- To the downside, support can be seen near 1,306.40 and 1,300.00 figure.
Additional key levels
XAU/USD
Overview:
Today Last Price: 1311.71
Today Daily change %: 0.05%
Today Daily Open: 1311.08
Trends:
Daily SMA20: 1301.98
Daily SMA50: 1280.88
Daily SMA100: 1251.29
Daily SMA200: 1231.61
Levels:
Previous Daily High: 1314.8
Previous Daily Low: 1306.65
Previous Weekly High: 1322.3
Previous Weekly Low: 1300.1
Previous Monthly High: 1326.25
Previous Monthly Low: 1275.9
Daily Fibonacci 38.2%: 1311.69
Daily Fibonacci 61.8%: 1309.76
Daily Pivot Point S1: 1306.88
Daily Pivot Point S2: 1302.69
Daily Pivot Point S3: 1298.73
Daily Pivot Point R1: 1315.03
Daily Pivot Point R2: 1318.99
Daily Pivot Point R3: 1323.18
