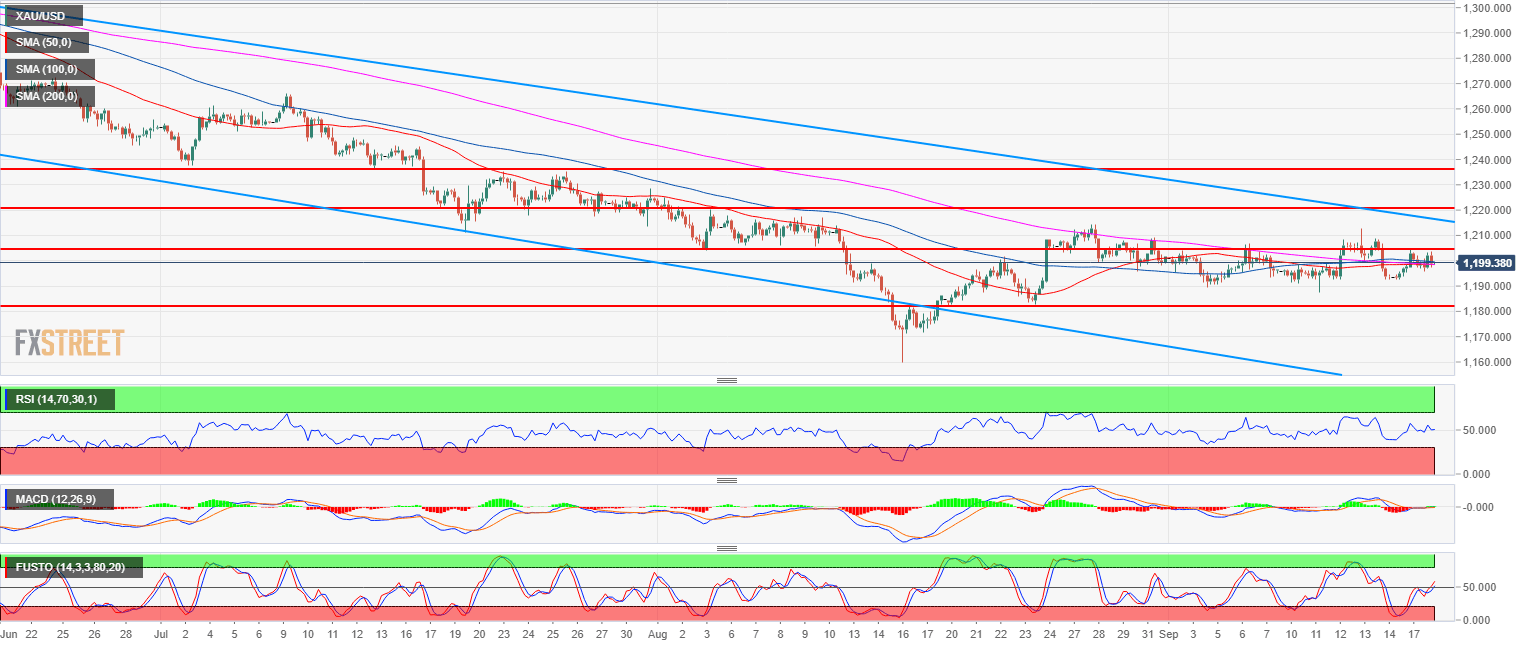
- Gold bear trend is on hold for the fifth consecutive week.
- The 50, 100 and 200-period simple moving averages are coiled together suggesting that Gold is in consolidation mode. The RSI and MACD indicators are neutral but bulls still consider the current consolidation as a bull flag while the market holds above 1,189.49 (September 4 low). Bulls target can be located near 1,225.90 (July 17 low).
- A break below 1,189.49 (September 4 low) would invalidate the bullish bias.
Spot rate: 1,200.00
Relative change: -0.14%
High: 1,203.54
Low: 1,195.60
Trend: Bearish
Short-term trend: Bullish above 1,182.90
Resistance 1: 1,204.10, August 3 swing low (key level)
Resistance 2: 1,211.17 July 19 low
Resistance 3: 1,214.30 August 28 high
Resistance 4: 1,217.89-1,220.90 zone, August 6 high and July 18 low
Resistance 5: 1,225.90 July 17 low
Support 1: 1,194.30 March 10, 2017 low
Support 2: 1,189.49 September 4 low
Support 3: 1,172.82 current 2018 low
Support 4: 1,145.20 March, 1 2017 low
